California has nearly half of the nation’s solar electricity generating capacity
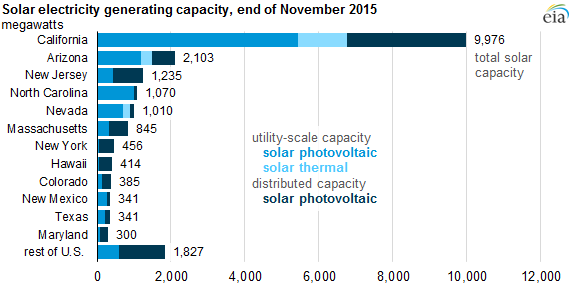
The United States has slightly more than 20,000 megawatts (MW) of solar generating capacity, which includes utility-scale solar photovoltaic (PV) and solar thermal installations, as well as distributed generation solar PV systems, also known as rooftop solar.
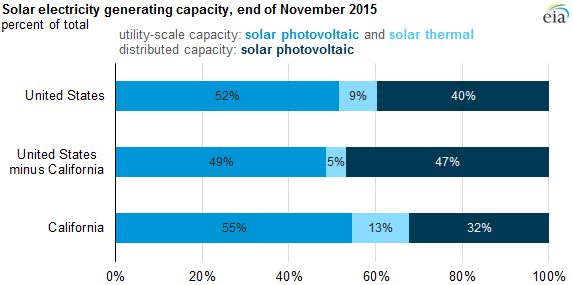
In 2014, California became the first state to generate at least 5% of its electricity from utility-scale solar plants (i.e., generators with at least one MW of capacity). Utility-scale solar makes up more than two-thirds of California's solar capacity, with utility-scale solar PV making up 55% and solar thermal systems such as concentrating solar making up another 13%. Distributed generation solar PV systems, often installed on rooftops of residential and commercial buildings, account for the remaining 32%.
Utility-scale systems in California make up a higher share (68%) than the national average of 60%. The mix of utility-scale versus distributed generation solar PV varies by state, often reflecting differences in state and local policies. For instance, 94% of North Carolina's 1,070 MW of installed solar capacity is utility-scale systems. In states like New York and Hawaii, distributed generation solar PV systems are more prevalent than utility-scale systems, making up 87% and 89%, respectively, of the total solar capacity in those states.
For both utility-scale solar PV and solar thermal, California has more capacity than the rest of the country combined, with 52% and 73% of the nation's total, respectively. All but 18 states have some utility-scale solar PV capacity, but only three states (California, Arizona, and Nevada) have utility-scale solar thermal resources, as these systems often require large, contiguous tracts of land in arid environments.
All but three states (Alaska, North Dakota, and South Dakota) have at least one megawatt of distributed generation solar PV capacity. EIA recently added estimates of distributed solar PV capacity and generation to tables in the Electric Power Monthly.
Overall, utility-scale solar systems make up about 1.1% of the total U.S. electric generating capacity, while distributed generation PV systems provide another 0.8%. Solar's share of electricity generation is slightly less (0.4% and 0.2%, for utility-scale and distributed), reflecting the intermittent nature of solar resources.
Principal contributor: Owen Comstock
Tags: California, capacity, electricity, generating capacity, renewables, solar, states