
Projections show U.S. becoming a net exporter of natural gas
Republished April 28, 2015, 11:00 a.m., to correct an error in the text.
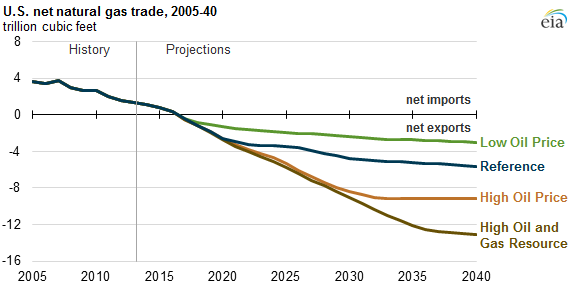
In its recently released Annual Energy Outlook 2015 (AEO2015), EIA expects the United States to be a net natural gas exporter by 2017. After 2017, natural gas trade is driven largely by the availability of natural gas resources and by world energy prices. Increased availability of domestic gas or higher world energy prices each increase the gap between the cost of U.S. natural gas and world prices that encourages exports of liquefied natural gas (LNG), and, to a lesser extent, greater exports by pipeline to Mexico.
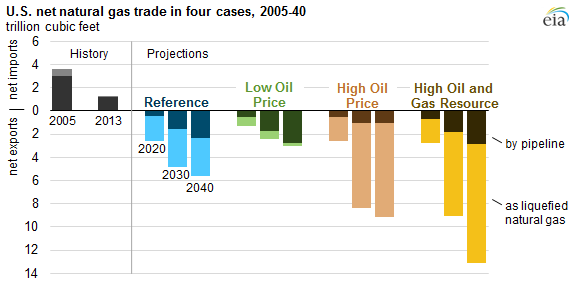
The AEO2015 examines alternate cases with higher and lower world oil price assumptions, which serve as a proxy for broader world energy prices given oil-indexed contracts, as well as with higher assumed U.S. oil and natural gas resources. These assumptions significantly affect projected growth in annual net LNG exports after 2017. Net LNG exports make up most of the natural gas exports in most cases. By 2040, LNG exports range from 0.2 trillion cubic feet (Tcf) in the Low Oil Price case to 10.3 Tcf in the High Oil and Gas Resource case. For comparison, 2040 natural gas net exports by pipeline range from 1.1 Tcf in the High Oil Price case to 2.9 Tcf in the High Oil and Gas Resource case.
Most of the growth in U.S. net natural gas exports occurs before 2030, as increased domestic natural gas supply satisfies new demand both internationally (with the development of LNG export capacity and growing demand for pipeline exports) and domestically (particularly in the industrial and electric power sectors). Increased shale gas production accounts for three-quarters of the increase in total dry gas production. More than half of the increase in shale gas production comes from the Haynesville and Marcellus formations.
Natural gas net exports are highest in the High Oil and Gas Resource case, which assumes both higher resources and improvements in technology to bring those resources to market. In this case, both net LNG and net pipeline exports in 2040 are higher than in any other AEO2015 case, because higher production capability lowers the cost of U.S. natural gas compared with prices in the world market.
In the High Oil Price and Low Oil Price cases, projected LNG exports vary in response to the price of oil-linked international LNG contracts. Contract prices are higher in the High Oil Price case, making U.S. LNG exports more competitive, while the opposite occurs in the Low Oil Price case. However, the relationship between international LNG prices and world oil prices is assumed to weaken later in the projection period, with the most decoupling of oil and natural gas prices occurring in the High Oil Price case.
U.S. pipeline exports of natural gas—most flowing south to Mexico—increase in all of the AEO2015 cases because increases in Mexico's production are not expected to keep pace with its growing natural gas demand. On the import side, pipeline imports from Canada, which accounted for 97% of total U.S. gross total imports of natural gas in 2013, continue as the source of nearly all U.S. gross natural gas imports through 2040, except in the Low Oil Price case, where gross imports of relatively less expensive international LNG contributes 22% of total imports in 2040.
Principal contributor: Michael Ford