
Energy consumption by U.S. government at lowest level since at least 1975
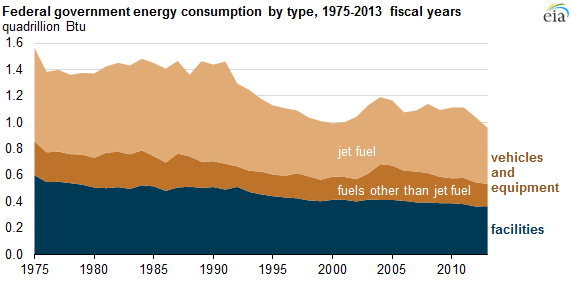
Note: Energy usage includes both civilian and military agencies.
The U.S. federal government, with thousands of facilities and vehicles in locations across the United States and abroad, is one of the largest energy consumers in the world, but that consumption is declining. The U.S. Department of Energy's Federal Energy Management Program (FEMP) shows total delivered-to-site energy use by the federal government fell to 0.96 quadrillion British thermal units (Btu) in fiscal year (FY) 2013, the lowest recorded since 1975, the earliest year for which data are available.
In FY 2013, vehicles and equipment energy usage accounted for 62% of all federal energy consumed, with the remainder consumed by federal facilities. The U.S. Department of Defense and the United States Postal Service together accounted for 94% of vehicles and equipment energy usage, which declined 19% from FY 2011 to FY 2013. Much of the decline since 2011 can be attributed to lower consumption of jet fuel, a major fuel source for the U.S. Air Force and the largest energy source consumed by the federal government.
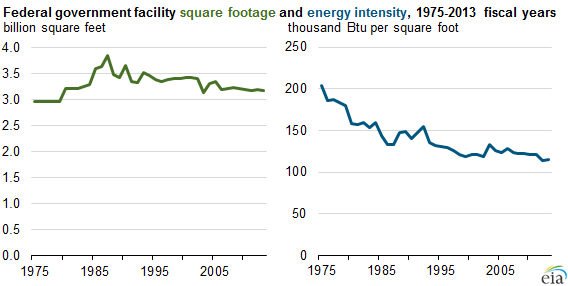
Energy consumed in federal government facilities has generally been declining over the past four decades. The reduction stems from both the total square footage occupied by the federal government, which continues to fall from its peak in FY 1987, and from the energy consumed per square foot inside federal buildings, which has been declining since FY 1975.
After reaching a record low in FY 2000 of $9.4 billion (adjusted for inflation), energy costs for the federal government generally increased over the next 13 years—FY 2013 total energy costs were $24 billion. Since most energy used by the federal government is petroleum based, the price of crude oil is a large factor in overall energy costs.
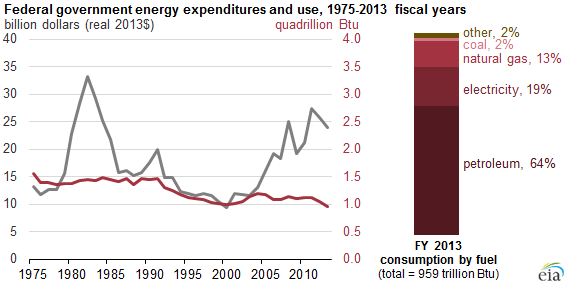
Note: Petroleum includes motor gasoline, aviation gasoline, diesel, liquefied petroleum gases, jet fuel, fuel oil, and navy special fuel oil. Other includes purchased steam, purchased renewable energy, and on-site renewables.
Several sustainability goals currently affecting energy consumption by the U.S. government were established by the Energy Independence Act (EISA) of 2007, which set requirements for federal agencies, including:
- Reduce petroleum fuel consumption in federal motor vehicles by at least 20% from an FY 2005 baseline by the start of FY 2016.
- Reduce energy intensity in buildings by 3% each year, or by a total of 30%, by FY 2015 relative to an FY 2003 baseline.
- Reduce energy consumption from fossil fuels in any new federal buildings acquired or currently-owned buildings undergoing extensive renovations by 65% in FY 2015 and work toward the goal of a 100% reduction by FY 2030 relative to an FY 2003 baseline.
A subsequent Executive Order issued by President Obama in 2009 further required federal facilities to:
- Meet guidelines on energy efficiency, water efficiency, and environmental impacts in 95% of the new contracts undertaken for products and services.
- Reduce potable water consumption intensity by 2% each year, or by a total of 26% by FY 2020, compared with an FY 2007 baseline.
Principal contributors: Rebecca George, Mary Joyce
Tags: buildings, consumption/demand