Menu
Crude oil, gasoline, heating oil, diesel, propane, and other liquids including biofuels and natural gas liquids.
Exploration and reserves, storage, imports and exports, production, prices, sales.
Sales, revenue and prices, power plants, fuel use, stocks, generation, trade, demand & emissions.
Energy use in homes, commercial buildings, manufacturing, and transportation.
Reserves, production, prices, employment and productivity, distribution, stocks, imports and exports.
Includes hydropower, solar, wind, geothermal, biomass and ethanol.
Uranium fuel, nuclear reactors, generation, spent fuel.
Comprehensive data summaries, comparisons, analysis, and projections integrated across all energy sources.
Monthly and yearly energy forecasts, analysis of energy topics, financial analysis, congressional reports.
Financial market analysis and financial data for major energy companies.
Greenhouse gas data, voluntary reporting, electric power plant emissions.
Maps, tools, and resources related to energy disruptions and infrastructure.
State energy information, including overviews, rankings, data, and analyses.
Maps by energy source and topic, includes forecast maps.
International energy information, including overviews, rankings, data, and analyses.
Regional energy information including dashboards, maps, data, and analyses.
Tools to customize searches, view specific data sets, study detailed documentation, and access time-series data.
EIA's free and open data available as API, Excel add-in, bulk files, and widgets
Come test out some of the products still in development and let us know what you think!
EIA's open source code, available on GitHub.
Forms EIA uses to collect energy data including descriptions, links to survey instructions, and additional information.
Sign up for email subscriptions to receive messages about specific EIA products
Subscribe to feeds for updates on EIA products including Today in Energy and What's New.
Short, timely articles with graphics on energy, facts, issues, and trends.
Lesson plans, science fair experiments, field trips, teacher guide, and career corner.
EIA is continuing normal publication schedules and data collection until further notice.
The U.S. Energy Information Administration estimates that the United States will be the world's top producer of petroleum and natural gas hydrocarbons in 2013
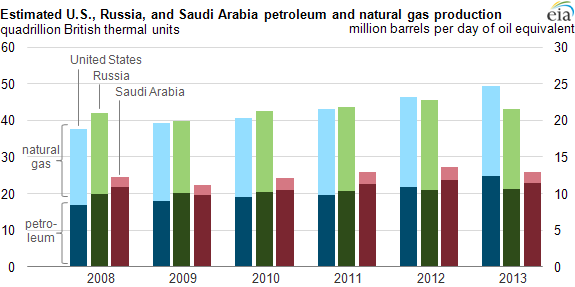
, surpassing Russia and Saudi Arabia. For the United States and Russia, total petroleum and natural gas hydrocarbon production, in energy content terms, is almost evenly split between petroleum and natural gas. Saudi Arabia's production, on the other hand, heavily favors petroleum.
Since 2008, U.S. petroleum production has increased 7 quadrillion Btu, with dramatic growth in Texas and North Dakota. Natural gas production has increased by 3 quadrillion Btu over the same period, with much of this growth coming from the eastern United States. Russia and Saudi Arabia each increased their combined hydrocarbon output by about 1 quadrillion Btu over the past five years.
Comparisons of petroleum and natural gas production across countries are not always easy. Differences in energy content of crude oil, condensates, and natural gas produced throughout these countries make accurate conversions difficult. There are also questions regarding the inclusion of biofuels and refinery gain in the calculations. Total petroleum and natural gas hydrocarbon production estimates for the United States and Russia for 2011 and 2012 were roughly equivalent—within 1 quadrillion Btu of one another. In 2013, however, the production estimates widen out, with the United States expected to outproduce Russia by 5 quadrillion Btu.
Principal contributors: Hannah Breul, Linda Doman
Tags: crude oil, international, liquid fuels, natural gas, oil/petroleum, Russia, Saudi Arabia