U.S. crude oil production could reach 10 million barrels per day by 2040
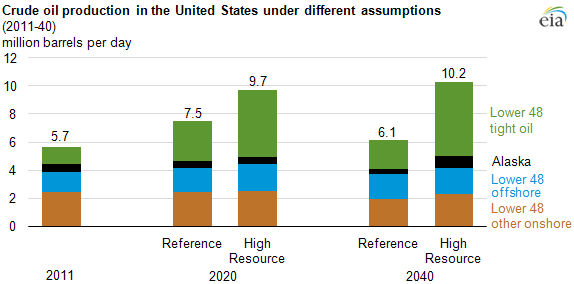
Projected crude oil production in the United States ranges from 6 to 8 million barrels per day (bbl/d) over the next 30 years in the Annual Energy Outlook 2013 (AEO2013) Reference case projection. However, under greater supply assumptions, crude oil production is sustained at a higher level of about 10 million bbl/d between 2020 and 2040 (see chart above).
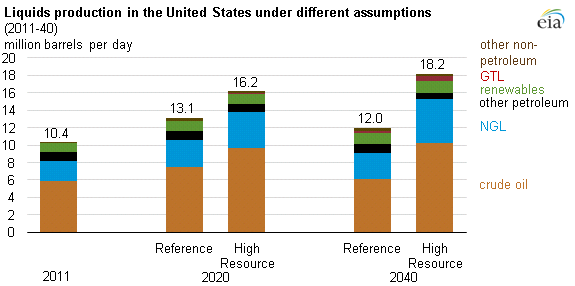
In this higher resource scenario, total U.S. liquid fuels production (which includes crude oil, natural gas liquids (NGL), refinery gains, biofuels, and other liquid fuels) increases to more than 18 million bbl/d in 2040, compared to 12 million bbl/d in the Reference case. That level of domestic production reduces net imports to 7% or less of total demand compared to 40% in 2012. Production projections inevitably reflect many uncertainties regarding the actual level of crude oil resources available, the difficulty or ease in extracting them, and the evolution of the technologies (and associated costs) used to recover them.
EIA developed a High Oil and Gas Resource case as part of the AEO2013 to examine the effects of higher domestic production on energy demand, imports, and prices. This alternative case presents a scenario in which U.S. crude oil production continues to expand after 2020, driven primarily by tight oil production. This increased production results from assumed greater technically recoverable tight oil resources, as well as undiscovered resources in Alaska and the offshore Lower 48 states. In addition, the maximum penetration rate for gas-to-liquids (GTL) is increased and kerogen (oil shale) is assumed to begin development. In the High Oil and Gas Resource case, NGL production increases from 2.2 million bbl/d in 2011 to 5.0 million bbl/d in 2040, compared to just under 3 million bb/d in 2040 in the Reference case. GTL output reaches about 0.6 million bbl/d, compared to about 0.2 million bbl/d in the Reference case (see chart below).
Estimates of technically recoverable resources from the rapidly developing tight oil formations are particularly uncertain and change over time as new information is gained through drilling, production, and technology experimentation. Projections embody many assumptions that might not prove to be valid over the long term and over all tight and shale formations. In the High Oil and Gas Resource case, the tight oil resources are increased by changing the estimated ultimate recovery (EUR) per well and assuming closer well spacing.
The increase in domestic supply results in a drop in the net import share of product supplied from about 37% in the Reference case to roughly 7% in the High Oil and Gas Resource case in 2040. Further decreases in net imports are achieved in the Low/No Imports case because of increased vehicle fuel efficiency. In this case, the net import share of product supplied is a negative 8% in 2040, which means 8% net exports.
Additional analysis of the High Oil and Gas Resource case and related Import Dependence side cases can be found in the full Annual Energy Outlook 2013.