
Natural gas prices in 2019 were the lowest in the past three years
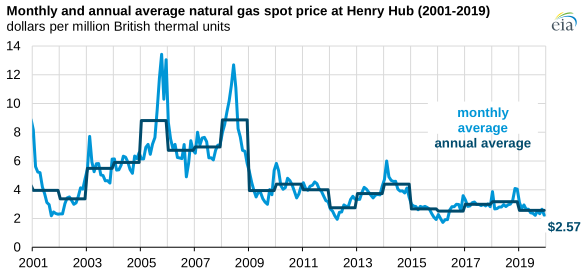
In 2019, natural gas spot prices at the national benchmark Henry Hub in Louisiana averaged $2.57 per million British thermal units (MMBtu), about 60 cents per MMBtu lower than in 2018 and the lowest annual average price since 2016. Lower natural gas prices in 2019 supported higher consumption—particularly in the electric generation sector—and higher natural gas exports. Continued growth in domestic production of natural gas also supported lower natural gas prices throughout the year.
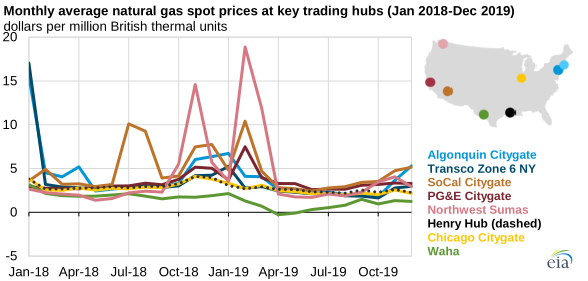
Monthly average natural gas prices at most key regional trading hubs in 2019 reached their highest levels in February, and they were relatively low and stable from April through December. In the Northeast, additional imports of liquefied natural gas (LNG) into New England limited price spikes during the winter of 2018–19. Despite a cold snap in the Midwest in February 2019, natural gas prices at Chicago Citygate were lower than during previous extreme weather events.
However, in the Pacific Northwest, unseasonably cold weather at the end of winter coupled with regional supply constraints and decreased storage inventories led to significant price spikes at the Northwest Sumas hub in March. Additional pipeline takeaway capacity in the Permian region eased some infrastructure constraints and increased regional prices at the Waha hub in western Texas after six consecutive months of prices lower than $1/MMBtu (March through August).
Natural gas consumption in the residential and commercial sectors increased by 2% in 2019 compared with 2018, based on the U.S. Energy Information Administration’s (EIA) monthly data through October and estimates for November and December. Natural gas use in the electric generation sector also increased in 2019, particularly in July and August when a heat wave in the Midwest and the Northeast led to record-high generation by natural gas-fired power plants.
Lower summer natural gas prices, which averaged $2.33/MMBtu in June through August (the lowest summer average Henry Hub natural gas price since 1998), have supported higher natural gas-fired generation in the summer months.
Dry natural gas production has grown every year since 2016. Production increased by 7.5 billion cubic feet per day (Bcf/d) (9%) through the first 10 months of the year after record growth in 2018. Sustained growth in natural gas production put downward pressure on prices, which continued to decline for most of 2019.
Natural gas storage inventories ended the withdrawal season at the end of March at their lowest levels since 2014. However, record natural gas production growth supported near-record injection activity during the injection season through October. The injection season ended with the second-highest net injection volume since 2014.
Most new pipelines placed in service in 2019 were located in the South Central and Northeast regions. These pipelines provide additional takeaway capacity out of the Permian and Appalachian supply basins and will serve growing demand for LNG exports, pipeline exports to Mexico, and U.S. natural gas-fired power generation.
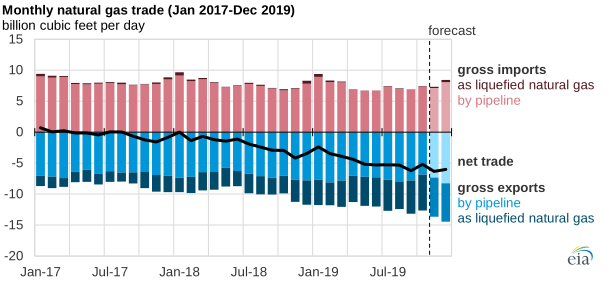
In 2019, natural gas exports—both by pipeline to Mexico and as LNG—continued to grow. U.S. natural gas exports to Mexico by pipeline averaged 5.1 Bcf/d in the first 10 months of 2019, 0.4 Bcf/d more than the 2018 average. Following an expansion in U.S. cross-border pipeline capacity, several new pipelines in Mexico continued to experience delays, limiting growth in exports.
U.S. LNG exports set a new record in 2019, averaging an estimated 5.0 Bcf/d (69% higher than in 2018) as the United States became the third-largest global LNG exporter. Several new LNG facilities were placed in service in 2019. Louisiana’s Cameron LNG placed its first liquefaction unit (referred to as a train) in service in May. Texas’s Freeport LNG exported its first cargo from the newly commissioned Train 1 in September, followed by its first export cargo from Train 2 in December. Corpus Christi LNG (also in Texas) commissioned its second train in July. In December, Georgia’s Elba Island placed in service the first three of its moveable modular liquefaction system (MMLS) units and exported its first LNG cargo.
Principal contributor: Victoria Zaretskaya
Tags: prices, natural gas