
U.S. natural gas production hit a new record high in 2018
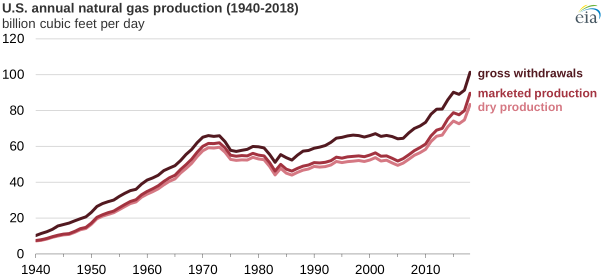
U.S. natural gas production grew by 10.0 billion cubic feet per day (Bcf/d) in 2018, an 11% increase from 2017. The growth was the largest annual increase in production on record, reaching a record high for the second consecutive year. U.S. natural gas production measured as gross withdrawals averaged 101.3 Bcf/d in 2018, the highest volume on record, according to EIA’s Monthly Crude Oil, Lease Condensate, and Natural Gas Production Report. U.S. natural gas production measured as marketed production and dry natural gas production also reached record highs at 89.6 Bcf/d and 83.4 Bcf/d, respectively.
U.S. natural gas gross withdrawals increased every month during 2018 except in June, ultimately reaching a record monthly high of 107.8 Bcf/d in December 2018. Marketed natural gas production and dry natural gas production also hit monthly record highs of 95.0 Bcf/d and 88.6 Bcf/d, respectively, in December 2018. Marketed production reflects gross withdrawals less natural gas used for repressuring wells, quantities vented or flared, and nonhydrocarbon gases removed in treating or processing operations. Dry natural gas is consumer-grade natural gas, or marketed production less extraction losses.
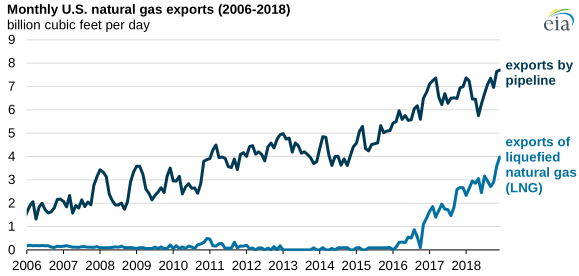
As natural gas production increased, the volume of natural gas exports—both through pipelines and as liquefied natural gas (LNG)—increased for the fourth consecutive year, reaching 9.9 Bcf/d. Total natural gas exports grew 14% in 2018, and LNG exports grew by 53% to 3.0 Bcf/d. Both pipeline and LNG exports reached record monthly highs in December 2018 of 7.7 Bcf/d and 4.0 Bcf/d, respectively. The United States continued to export more natural gas than it imported in 2018, after being a net exporter in 2017 for the first time in nearly 60 years.
In September 2018, the United States exported more natural gas by pipeline than it imported by pipeline for the first time in at least 20 years. Forecasts in EIA’s Short-Term Energy Outlook show that natural gas exports by pipeline will exceed natural gas imports by pipeline in 2019 for the year.
The Appalachian region remained the largest natural gas-producing region in the United States. Appalachian natural gas from the Marcellus and Utica/Point Pleasant shales of Ohio, West Virginia, and Pennsylvania continued to grow, with gross withdrawals increasing from 24.2 Bcf/d in 2017 to 28.5 Bcf/d in 2018. Ohio saw the largest percentage increase in gross withdrawals of natural gas, up 34%, in 2018 to 6.5 Bcf/d.
Texas saw the largest total volumetric gain in gross withdrawals in 2018, increasing to 24.1 Bcf/d, up from the state’s 2017 production of 21.9 Bcf/d. Texas’s increase in natural gas production is mainly because of the development in the Permian Basin and Haynesville Shale formation. According to EIA’s Drilling Productivity Report, in 2018, production in the Permian increased by 2.7 Bcf/d, or 32%, while production in the Haynesville increased by 2.2 Bcf/d, or 34%.
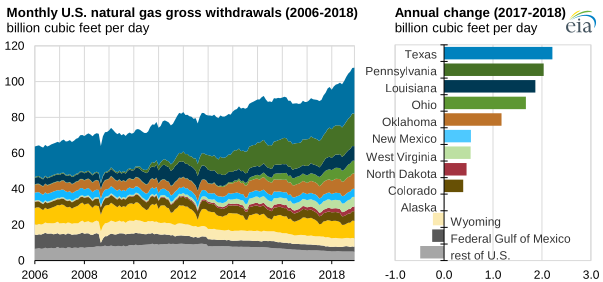
EIA’s Monthly Crude Oil, Lease Condensate, and Natural Gas Production Report collects monthly oil and natural gas production data from a sample of operators of oil and natural gas wells in 15 states, the Federal Offshore Gulf of Mexico, and collectively from the remaining states and the Federal Offshore Pacific.
Principal contributor: Emily Geary