
The United States produced more crude oil than any other country in 2025
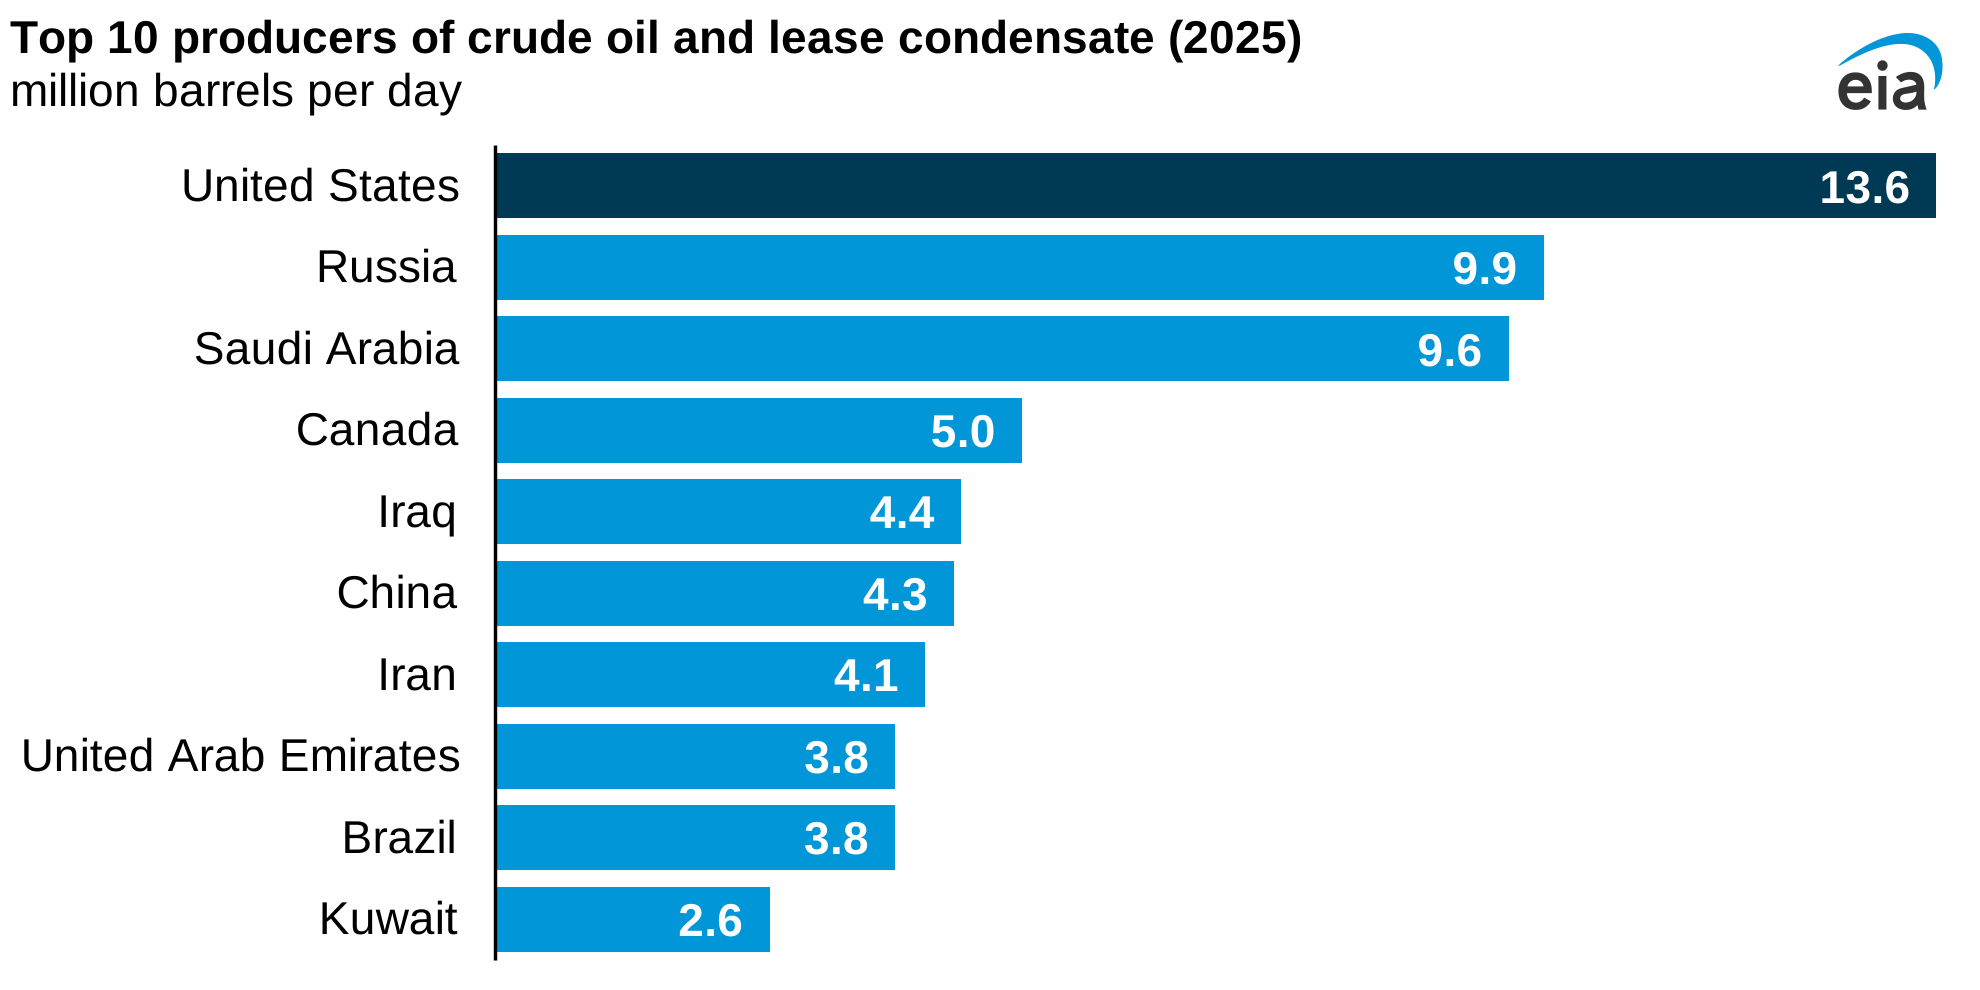
The United States remained the world’s largest crude oil producer in 2025, according to our International Energy Statistics database, extending a streak that began in 2018 when the United States overtook Russia to become the world’s leading producer.
Crude oil production in the United States, including lease condensate, averaged a record-high 13.6 million barrels per day (b/d) in 2025, breaking the previous U.S. and global production record of 13.2 million b/d set in 2024. U.S. crude oil production was about 40% higher on average in 2025 than that from the next two largest global crude oil producers, Russia and Saudi Arabia.
U.S. crude oil production has been buoyed by continued gains in drilling productivity and operational efficiency across key shale basins, which allow operators to extract more oil per well. The growth in output continued in 2025 despite lower oil prices; West Texas Intermediate (WTI) prices dropped from an average of $77/b in 2024 to $65/b in 2025 amid global oversupply. Production growth was particularly strong in the Permian Basin of Texas and New Mexico, which had a 4% increase in crude oil production, from 6.3 million b/d in 2024 to 6.6 million b/d in 2025. The Permian accounted for approximately 48% of U.S. production in 2025.
Shale oil and gas development in the United States became notable when in 2008 it reversed a multi-decade decline in U.S. crude oil production. U.S. crude oil production powered by shale development has turned the United States into not just the world’s largest producer, but the largest producer of crude oil ever.
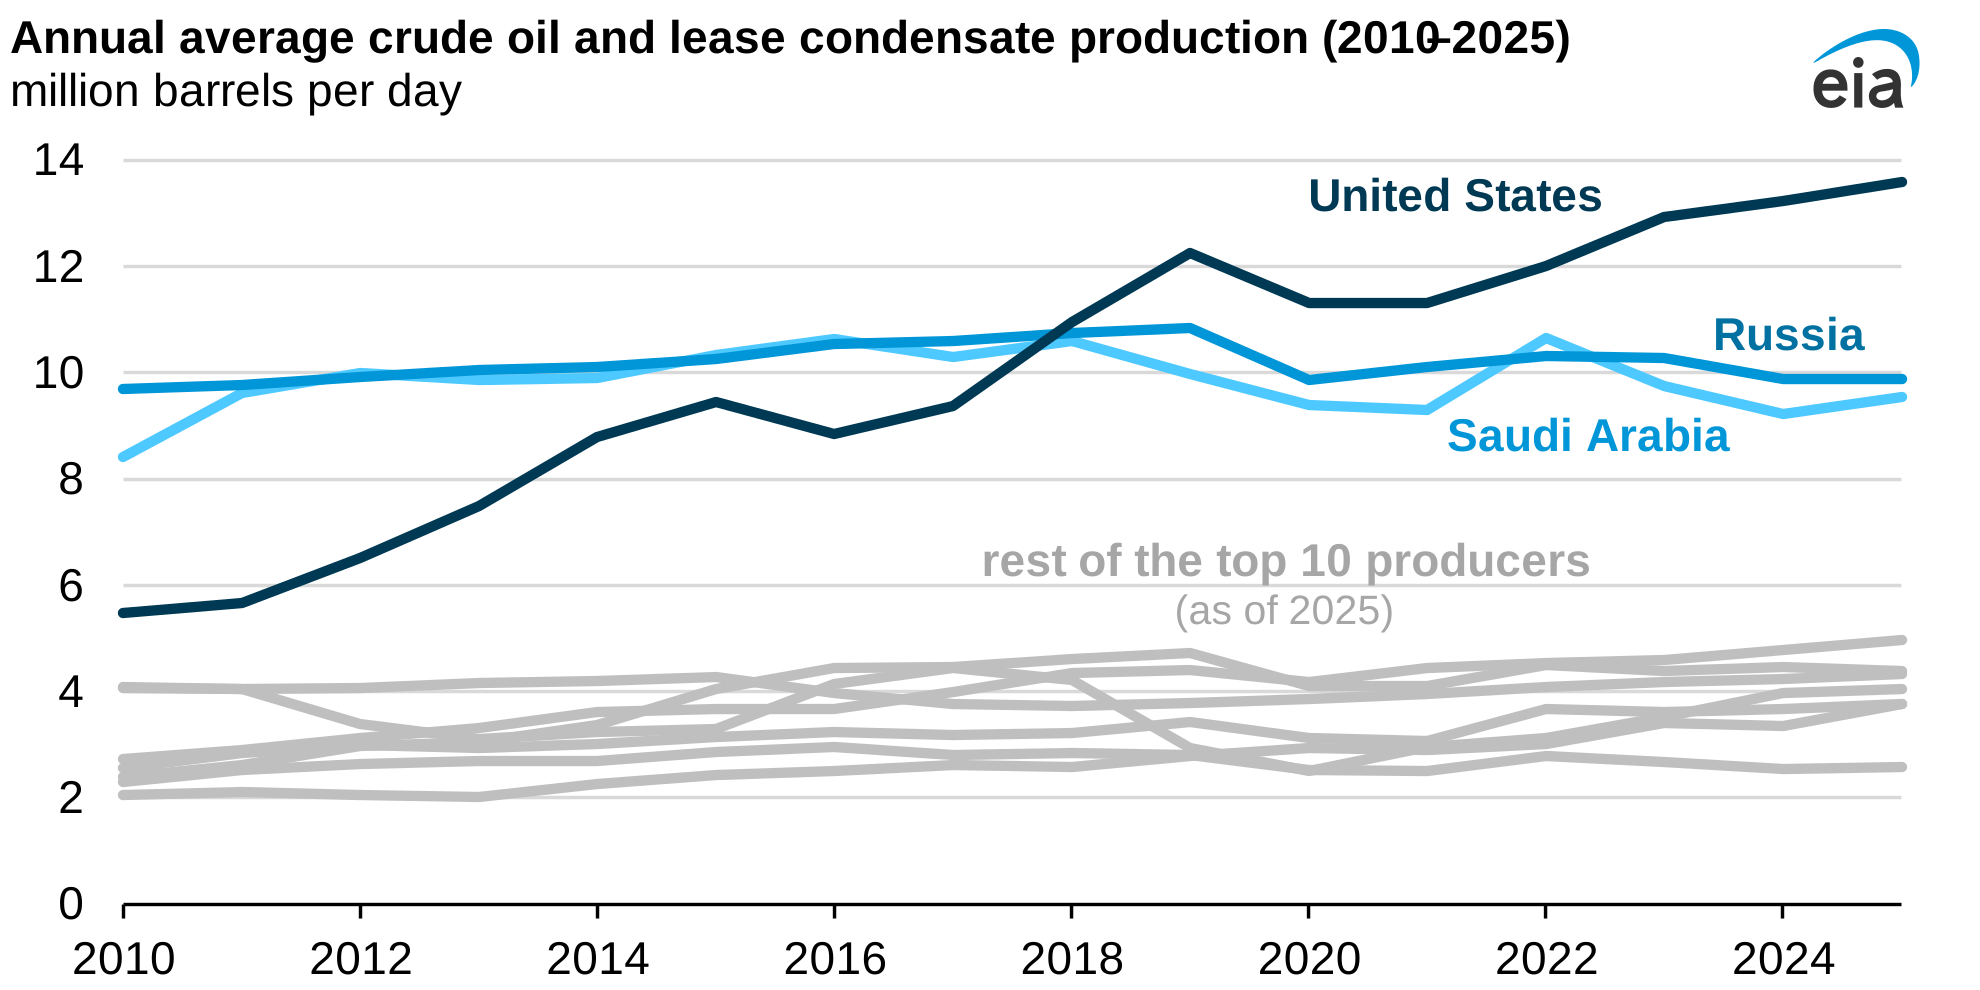
The difference between the United States and other major producers widened in 2025, with Russian output largely unchanged and Saudi Arabia recording modest growth as a result of OPEC+ unwinding voluntary production cuts. Crude oil production including lease condensate in Saudi Arabia increased from 9.2 million b/d in 2024 to 9.6 million b/d in 2025. Russia's crude oil production averaged 9.9 million b/d in 2024 and remained largely unchanged in 2025 as a combination of voluntary production cuts and effects of the conflict with Ukraine limited crude oil output growth.
Looking ahead, we forecast U.S. crude oil production will remain near 13.7 million b/d in 2026, before increasing to 14.2 million b/d in 2027 based on our latest Short-Term Energy Outlook. Production growth comes amid rising prices as WTI prices increase by $22/b to $88/b in 2026. In addition to the WTI price increase, continued shale well productivity improvements will also drive growth.
Parallel to the growth in crude oil production, U.S. associated natural gas production has also surged, driven by activity in oil-dominant plays like the Permian. This abundance of associated gas has continued to support domestic natural gas-fired electricity generation and growing natural gas exports. In 2024, the most recent year data are available, the United States was the world’s largest natural gas producer. We will release 2025 natural gas production data in our International Energy Statistics database later this year.
Principal contributors: Naser Ameen, Troy Cook