U.S. Energy Information Administration logo
Skip to sub-navigation
In-brief analysis
September 2, 2025

Ten counties in the Permian Basin account for 93% of U.S. oil production growth since 2020
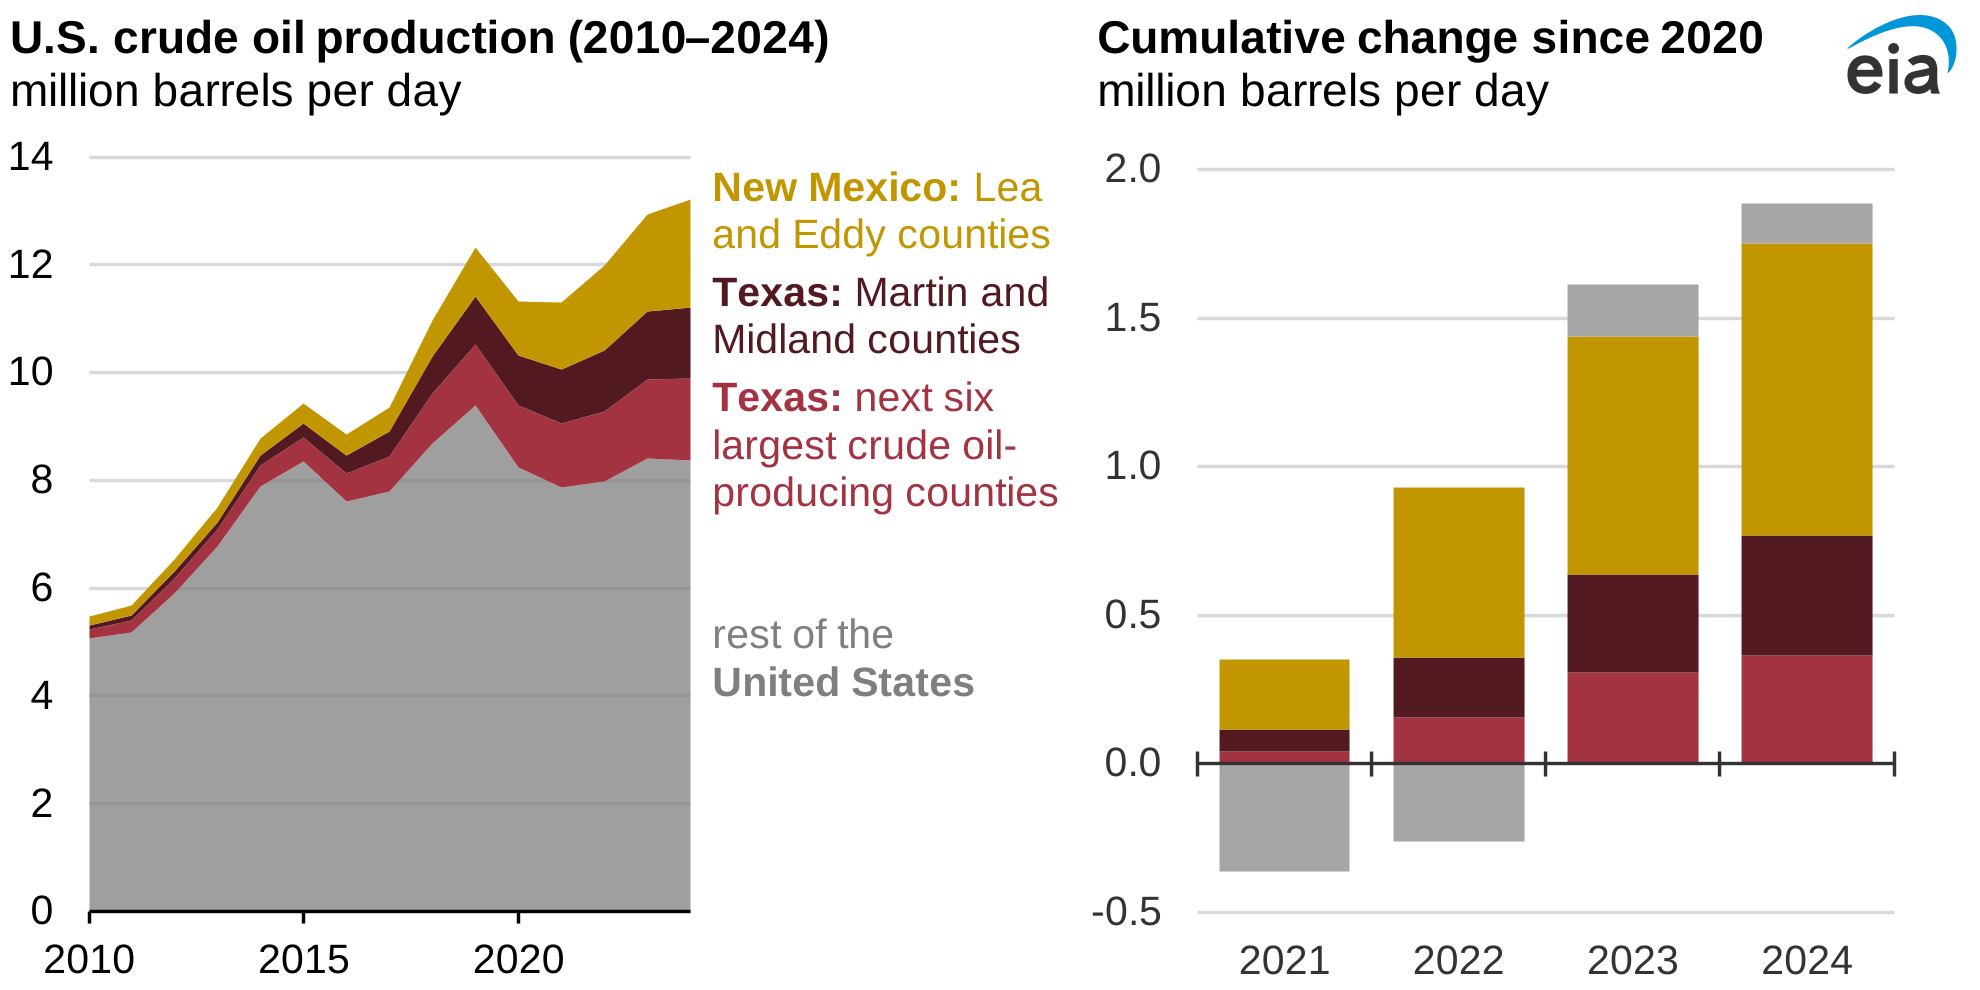
U.S. crude oil production and cumulative change since 2020

Data source: U.S. Energy Information Administration, Petroleum Supply Monthly (total U.S. production) and Enverus (county-level data)
Data values: U.S. Field Production of Crude Oil

Between 2020 and 2024, total crude oil and lease condensate production in the United States grew by 1.9 million barrels per day (b/d), 93% of which was produced from just 10 counties in Texas and New Mexico. Production from the rest of the United States, including producing areas in offshore state or federal waters, grew by just 130,000 b/d.

The 10 counties are all within the Permian Basin, a large geologic feature underlying 66 counties in New Mexico and Texas. Two of these counties, Lea and Eddy in New Mexico, accounted for nearly 1.0 million b/d of U.S. production growth (52%) between 2020 and 2024. Martin and Midland in Texas accounted for an additional 0.40 million b/d (21%). Six additional counties in Texas—Andrews, Glasscock, Howard, Loving, Reagan, and Ward—together grew by 0.36 million b/d (19%), based on county-level production data from Enverus.

Crude oil and lease condensate production in these 10 counties averaged 4.8 million b/d in 2024, 37% of the U.S. total. Within these 10 counties, the primary geologic units responsible for this growth are the Bone Spring, Spraberry, and Wolfcamp formations.

These geologic units have been the main sources of oil production growth across the Permian Basin and the United States at large since 2020. Crude oil and natural gas production from U.S. tight oil and shale gas formations can be found in Table 10b in the Short-Term Energy Outlook.

Principal contributor: Troy Cook

Statistics
Analysis
Tools
Education
News

Petroleum & Other Liquids

Crude oil, gasoline, heating oil, diesel, propane, and other liquids including biofuels and natural gas liquids.

Natural Gas

Exploration and reserves, storage, imports and exports, production, prices, sales.

Electricity

Sales, revenue and prices, power plants, fuel use, stocks, generation, trade, demand & emissions.

Coal

Reserves, production, prices, employment and productivity, distribution, stocks, imports and exports.

Nuclear & Uranium

Uranium fuel, nuclear reactors, generation, spent fuel.

Renewable & Alternative Fuels

Includes hydropower, solar, wind, geothermal, biomass and ethanol.

EIA Survey Forms

Forms EIA uses to collect energy data including descriptions, links to survey instructions, and additional information.

Total Energy

Comprehensive data summaries, comparisons, analysis, and projections integrated across all energy sources.

U.S. States

State energy information, including overviews, rankings, data, and analyses.

International

International energy information, including overviews, rankings, data, and analyses.

Environment

Greenhouse gas data, voluntary reporting, electric power plant emissions.

Data Tools, Apps, & Maps

Tools to customize searches, view specific data sets, study detailed documentation, and access time-series data.

Open Data

EIA's free and open data available as API, Excel add-in, bulk files, and widgets

EIA Beta

Come test out some of the products still in development and let us know what you think!

Open Source Code

EIA's open source code, available on GitHub.

RSS Feeds

Subscribe to feeds for updates on EIA products including Today in Energy and What's New.