
Crude oil prices increased in 2017, and Brent-WTI spread widened
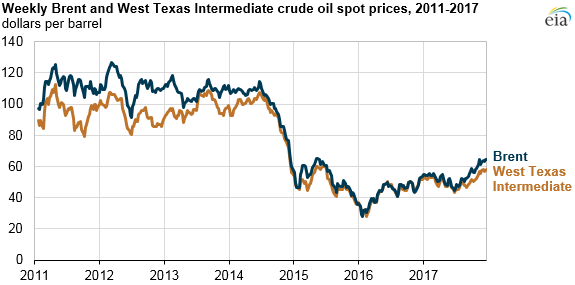
Crude oil prices ended 2017 at $60/barrel (b), the highest end-of-year price since 2013. West Texas Intermediate (WTI) crude oil prices averaged $51/b in 2017, up $7/b from the 2016 average, and ended the year $6/b higher than at the end of 2016. Brent prices have moved up $10/b since the end of 2016 and ended the year at $65/b, widening the Brent-WTI spread to $5/b at the end of the year, the largest difference since 2013.
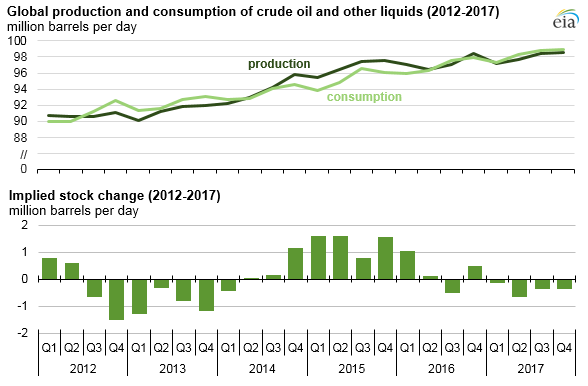
Despite relatively high U.S. crude oil production, curtailments in production by members of the Organization of the Petroleum Exporting Countries (OPEC) and robust global demand supported crude oil price increases in 2017. The OPEC agreement to curtail crude oil production in 2017 and subsequent extension of that agreement through 2018 tightened crude oil supplies, which put upward pressure on crude oil prices.
The price spread between Brent and WTI was significantly greater in 2017 than in 2016. Lower domestic crude oil prices made U.S. crude oil more competitive in international markets and supported record U.S. crude oil exports. Domestic demand was also higher: U.S. product supplied for crude oil and petroleum products was the highest level since 2007.
U.S. highlights
- U.S. crude oil production increased in 2017 by more than 384,000 barrels per day (b/d) to 9.2 million b/d, based on data through September and estimates from the December Short-Term Energy Outlook (STEO) for the remainder of 2017. The increase was driven by Lower 48 onshore production (especially in the Permian Basin area) with an estimated increase of nearly 330,000 b/d from 2016 to 2017.
- The Brent-WTI price spread averaged more than $3.33/b in 2017. In 2016, the average price difference was less than $1/b.
- Crude oil export volumes and the number of destinations for those exports continued to increase. U.S. exports of crude oil averaged 1.0 million b/d through October 2017, on pace for a record high and an increase of 445,000 b/d from the 2016 average.
- Based on data through October 2017, average U.S. imports of crude oil increased by more than 103,000 b/d from the 2016 level to nearly 8.0 million b/d in 2017, the highest level since 2012. Canada, Saudi Arabia, and Venezuela were the largest foreign suppliers of crude oil to the United States.
- The average volume of U.S. product supplied for crude oil and petroleum products was 19.8 million b/d through October, the highest level since 2007.
- On August 25, 2017, Hurricane Harvey made landfall in the U.S. Gulf Coast, disrupting refinery and port operations and resulting in a steep decrease in refinery operations.
International highlights
- EIA estimates OPEC crude oil production averaged 32.5 million b/d in 2017, a 0.2 million b/d decrease from the 2016 levels.
- OPEC and the non-OPEC countries that agreed to crude oil production cuts in 2017 also agreed to continue limiting output through the end of 2018. Saudi Arabia and Russia will co-chair a monitoring committee designed to assess the group’s adherence to the production targets. The group plans to reassess target production levels at its June 2018 meeting in the context of market conditions at that time.
- A pipeline outage in the North Sea contributed to higher Brent crude oil prices in December, further widening the Brent-WTI spread.
Principal contributor: Matt French