Menu
Crude oil, gasoline, heating oil, diesel, propane, and other liquids including biofuels and natural gas liquids.
Exploration and reserves, storage, imports and exports, production, prices, sales.
Sales, revenue and prices, power plants, fuel use, stocks, generation, trade, demand & emissions.
Energy use in homes, commercial buildings, manufacturing, and transportation.
Reserves, production, prices, employment and productivity, distribution, stocks, imports and exports.
Includes hydropower, solar, wind, geothermal, biomass and ethanol.
Uranium fuel, nuclear reactors, generation, spent fuel.
Comprehensive data summaries, comparisons, analysis, and projections integrated across all energy sources.
Monthly and yearly energy forecasts, analysis of energy topics, financial analysis, congressional reports.
Financial market analysis and financial data for major energy companies.
Greenhouse gas data, voluntary reporting, electric power plant emissions.
Maps, tools, and resources related to energy disruptions and infrastructure.
State energy information, including overviews, rankings, data, and analyses.
Maps by energy source and topic, includes forecast maps.
International energy information, including overviews, rankings, data, and analyses.
Regional energy information including dashboards, maps, data, and analyses.
Tools to customize searches, view specific data sets, study detailed documentation, and access time-series data.
EIA's free and open data available as API, Excel add-in, bulk files, and widgets
Come test out some of the products still in development and let us know what you think!
EIA's open source code, available on GitHub.
Forms EIA uses to collect energy data including descriptions, links to survey instructions, and additional information.
Sign up for email subscriptions to receive messages about specific EIA products
Subscribe to feeds for updates on EIA products including Today in Energy and What's New.
Short, timely articles with graphics on energy, facts, issues, and trends.
Lesson plans, science fair experiments, field trips, teacher guide, and career corner.
EIA is continuing normal publication schedules and data collection until further notice.
With data for 2010 | Release Date: September 24, 2012 | Next Release Date: Discontinued | full report
year: 2009 2008 2007 2006 2005 2004 2003
In 2010, a total of 776 electric industry participants reported having customers in green pricing programs, 14 percent more than in 2009. The number of customers in green pricing programs grew by 8 percent in 2010, reaching a new high of 1,216,582 out of a nationwide customer base of 144,140,2581 (Figure 1 and Table 1).
figure data
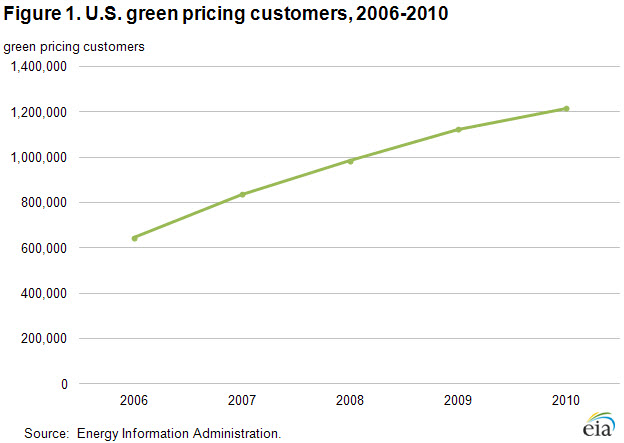
Texas had the most customers with 411,615 in 2010, followed by Oregon with 122,671, New York with 91,532 and California with 82,848. Although participation varied widely, every state had some green pricing customers, except Alaska and Hawaii. The net increase in customers for the year was 92,804, led by large increases in Texas and New York. There were also some states (such as Minnesota and Tennessee) with sharp decreases. Ninety-three percent of green pricing customers nationwide were residential.
A total of 694 electric industry participants reported having net metering customers in 2010, with customers in every state except Tennessee (Table 2).
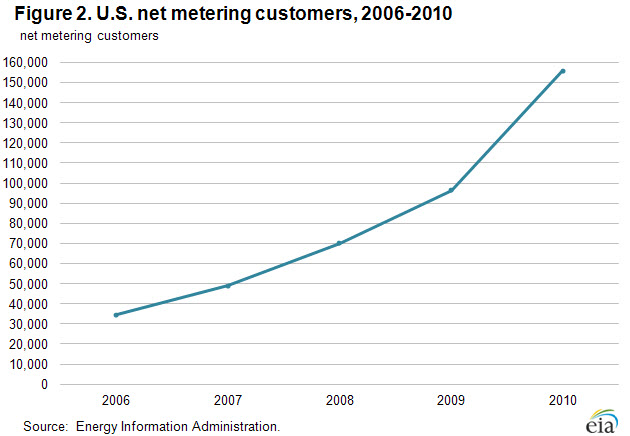
 figure data Net metering customers totaled 155,841 in 2010, 61 percent more than in 2009 (Figure 2). California had, by far, the largest number of net metering customers with 86,495, or 56 percent of the U.S. total. California also accounted for more than half of the increase in 2010. Ninety-one percent of net metering customers nationwide were residential.
1See also Electric Power Annual 2010, Table 7.5.