
U.S. ENERGY INFORMATION ADMINISTRATION
WASHINGTON DC 20585
FOR IMMEDIATE RELEASE
January 23, 2019
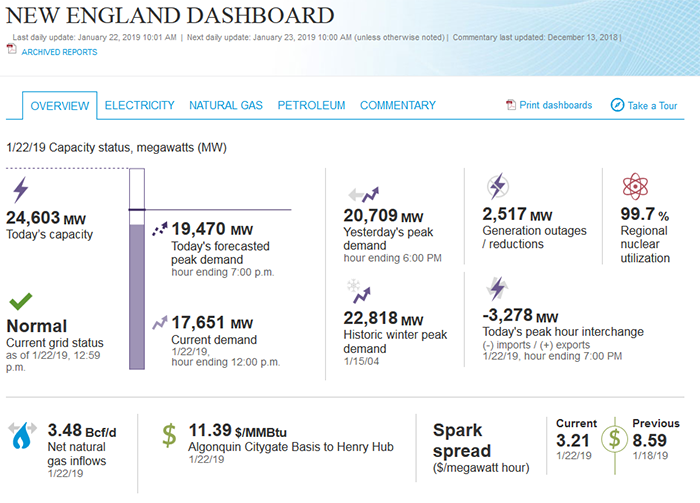
New interactive New England dashboard tracks energy capacity constraints
In order to increase understanding of weather-related energy capacity issues in New England, EIA has begun publication of an interactive dashboard that provides timely information about energy market conditions in that region. The New England Dashboard (NED) provides an integrated view of the energy commodities—natural gas/liquefied natural gas, electricity, and petroleum products—and market-influencing fundamentals—such as weather—that can influence energy consumption, prices, flows, and security in the region.
The NED is designed to help analysts and decision makers examine many key aspects of the New England energy market: evolving fuel diversification, wholesale price volatility, energy delivery dynamics, the influence of weather on operations, the relationship between electricity prices and fuel prices, and the disposition of regional and on-site fuel stocks.
EIA will post updates to the New England Dashboard every day by 10:30 a.m. eastern time, including on weekends.
The NED includes detailed regional information on:
- status of the electric grid
- generation fuel mix
- outages and available capacity
- electricity consumption (current and projected load)
- locational marginal prices
- inter-regional electric transmission and natural gas flows
- liquefied natural gas (LNG) imports
- fuel prices
- petroleum product stocks
- temperatures
NED information sources include a combination of EIA and third-party data. Key sources of non-EIA data include actual and forecast temperatures from the National Oceanic and Atmospheric Administration (NOAA); various electric price, load, generation, interchange, operating statistics, and fuel mix information from the Independent System Operator New England (ISO-NE); natural gas demand, LNG imports, and natural gas pipeline flows from OPIS PointLogic; crude oil and petroleum product prices from Refinitiv; and spot natural gas prices from S&P Global Market Intelligence.
EIA has incorporated many interactive features into the NED. Readers are able to select information by fuel, choose customized time periods and other ranges for graphics using tabbed labels, display data contents on graphs using the mouse cursor, animate temperature trends, print the entire dashboard as well as individual visualizations, download selected data series or images, and even automate data transfer through access to real-time information Application Programming Interface calls. In addition to the data visualizations, the commentary section will provide analysis of recent New England energy market conditions when the situation warrants more insight.
Energy delivery infrastructure constraints and outages can have a pronounced influence on New England’s wholesale energy prices, energy flows, and operations. As a result, NED features measurements that illustrate these constraints including nuclear generating capacity availability, real-time locational marginal prices by ISONE zone and electric interface, electric generation outages and reductions, and an interactive map indicating natural gas pipeline capacity use at key flow points affecting New England.
The New England Dashboard can be found at:
https://www.eia.gov/dashboard/newengland
EIA Press Contact: Jonathan Cogan, 202-586-8719, Jonathan.Cogan@eia.gov
EIA-2019-01