
U.S. ENERGY INFORMATION ADMINISTRATION
WASHINGTON DC 20585
FOR IMMEDIATE RELEASE
March 19, 2013
Manufacturing sector energy use and energy intensity down since 2002
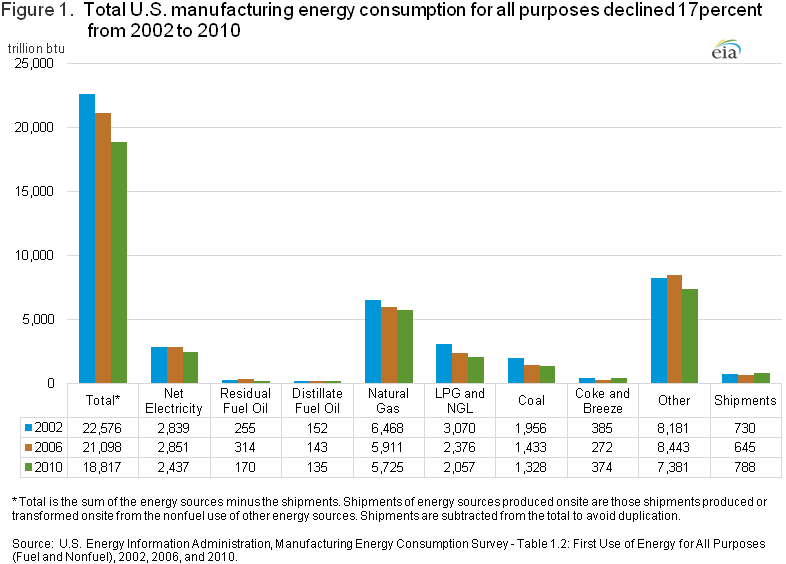
Total energy consumption in the manufacturing sector decreased by 17 percent from 2002 to 2010, according to data released today by the U.S. Energy Information Administration. Manufacturing gross output decreased by only 3 percent over the same period. Taken together, these data indicate a significant decline in the amount of energy used per unit of gross manufacturing output. The significant decline in energy intensity reflects both improvements in energy efficiency and changes in the manufacturing output mix. Consumption of every fuel used for manufacturing declined over this period.
The manufacturing sector comprised over 11 percent of gross domestic product (GDP) in 2010. The manufacturing base in the United States is broad, producing items as varied as the food we eat to the clothes we wear. Manufacturing includes energy-intensive industries (those that use relatively large amounts of energy) such as petroleum refining, chemicals, aluminum, iron and steel, paper, wood products, and food, as well as less energy-intensive industries such as textiles, leather, apparel, furniture, machinery, and electrical equipment.
Energy for manufacturing can be consumed in two ways: as a fuel or as a feedstock (material input to a final product). Energy consumed as a fuel includes all energy used for heat and power. Energy used as feedstock is the use of energy sources for raw material input or for any purpose other than the production of heat or power.
U.S. manufacturing used over 14 quadrillion Btu of energy as a fuel in 2010, a decrease of 13 percent from the 2002 level. Fuel consumption in the five most energy-intensive subsectors accounted for 81 percent of fuel use in manufacturing. Two energy-intensive subsectors (petroleum and coal products, and food) showed 3.5 percent increases in their fuel consumption from 2002 to 2010.

Feedstock energy use in U.S. manufacturing accounts for more than 6 percent of all energy consumed in the country. Although nearly all manufacturers use energy as a fuel, 99 percent of feedstock energy use occurs in only three manufacturing subsectors: primary metals, chemicals, and petroleum and coal products.
Although overall manufacturing output declined by 3 percent between 2002 and 2010, some manufacturing industries grew over the period. The gross output for the petroleum and coal products subsector grew by about 3 percent, while the gross output for the food subsector increased by 5 percent. However, during this same period the number of employees in both subsectors fell, the petroleum and coal products subsector by 6,000 employees, and the food subsector by 115,000 employees. The reduction in employment, along with an increase in gross output signals an increase in labor productivity in these two subsectors.
These data, among others, are drawn from the detailed results of EIA's 2010 Manufacturing Energy Consumption Survey (MECS). The 2010 MECS is EIA's eighth survey of the manufacturing sector and covers the U.S. and four Census regions (Northeast, Midwest, South, and West). Previous surveys were conducted for 1985, 1988, 1991, 1994, 1998, 2002, and 2006, respectively. Future MECS are planned for every four years. Data collection for the 2014 MECS will begin in 2015.
EIA Program Contact: Thomas Lorenz, 202-586-3442, thomas.lorenz@eia.gov
EIA Press Contact: Jonathan Cogan, 202-586-8719, jonathan.cogan@eia.gov
EIA-2013-4