Interregional Electricity Trade in India
Release Date: 10/14/2020 | Full report

Introduction
India’s electricity consumption has increased significantly since 2010, growing from a little more than 700 billion kilowatthours (BkWh) to 1,500 BkWh in 2019, with a projected rise to 6,200 BkWh in 2050, according to the U.S. Energy Information Administration’s (EIA) International Energy Outlook 2019 (IEO2019). In tandem with growing electricity consumption, India is expanding its electric transmission infrastructure to allow electricity trade between regions of the country.[1] The development of India’s electric transmission infrastructure can affect electric generating capacity expansion decisions, particularly in the long term, which would affect its longer-term fuel demands. In this analysis, EIA considers how interregional electricity grid connections could influence India’s future electricity generating fuel choices, particularly the interrelationship between renewable capacity additions and electric transmission limits.
In IEO2019, EIA modeled the power market in India as a single region with perfect transmission connectivity. In this analysis, we increased the geographical detail in India to represent five distinct regional power grids to capture the effects of the associated transmission interconnections on capacity expansion decisions. When power regions trade electricity with each other, differences in electricity consumption between the regions enable a region with excess electricity to sell relatively lower cost electricity, such as electricity generated from solar and wind, to a region with higher demand that would otherwise be met with higher cost generation. This analysis finds that electricity grid interconnections influence India’s electricity sector’s fuel choices for electric generation. With limited connectivity between regions, lower cost generation from renewables cannot be shared freely across India, and existing fossil fuel generation typically serves in-region demand. Regardless of the level of connectivity, the share of coal generation declines over the projection horizon as solar and wind become more cost competitive to meet incremental regional demand.
Market Description
Electricity supply
Through 2019, electricity generated in India was predominantly produced from fossil fuel-fired sources, particularly coal. EIA’s International Energy Statistics data show that fossil fuel-fired generation accounted for more than 80% of India’s total electricity generation in 2018. The share of electricity generated from non-hydroelectric renewables also increased, from 34 billion kilowatthours (BkWh) in 2010 to 189 BkWh in 2019, representing about 12% of total electricity generation in 2019. Furthermore, in 2019, the government of India set renewable installed capacity targets to double the current hydropower capacity and increase total renewables capacity by a factor of five by 2030, which would further increase the share of renewables to the electrical grid.
In 2013, India’s five mainland regional grids were connected created a nationwide synchronous power grid. The five power grids include Northern Region, Eastern Region, Western Region, Northeastern Region, and Southern Region grids (Figure 1).
Figure 1. India regional power grids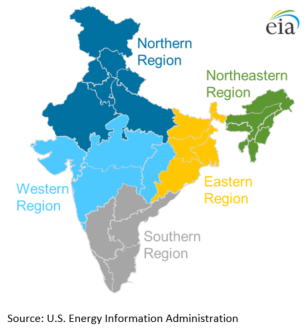
In addition to proximity to demand and power plant economics, the installed capacity in each grid region partially reflects where resources are located. The Eastern Region has the largest coal reserves in the country. Although its capacity mix is dominated by coal, this region is relatively small and accounted for only 14% of India’s total coal-fired capacity as of 2018 (Table 1). Hydroelectric is the second-largest source of generating capacity in India, and most of the capacity (44% of the country’s hydropower capacity) is located in the hydro-rich Northern Region. The Western Region has the largest electricity demand, and it maintains the largest share of coal-fired generating capacity (37% of the country’s capacity) and natural gas-fired generating capacity (44% of the country’s capacity) and has access to more than half of India’s liquefied natural gas import capacity. The Northern Region has the second-highest coal-fired generating capacity (26% of the country’s capacity); however, the region has the second-lowest proven coal and lignite reserves.[2] The majority of wind and solar power plants are located in the Southern Region and Western Region, where wind resources are highest.[3] Solar capacity is more concentrated in the Southern Region, which holds more than 50% of the country’s total installed solar capacity.
| Region | Coal | Gas | Diesel | Nuclear | Hydro | Wind | Solar | Other | Total |
|---|---|---|---|---|---|---|---|---|---|
| Northern Region | 51,940 | 5,781 | - | 1,620 | 19,808 | 4,300 | 5,823 | 4,508 | 93,780 |
| Western Region | 74,348 | 10,806 | - | 1,840 | 7,448 | 13,387 | 6,169 | 3,566 | 117,564 |
| Southern Region | 46,182 | 6,473 | 562 | 3,320 | 11,775 | 17,935 | 15,491 | 5,335 | 107,072 |
| Eastern Region | 27,463 | - | 100 | - | 4,942 | - | 660 | 800 | 33,965 |
| Northeastern Region | 770 | 1,775 | 36 | - | 1,427 | - | 38 | 300 | 4,346 |
| Total | 200,703 | 24,835 | 698 | 6,780 | 45,399 | 35,622 | 28,181 | 14,510 | 356,727 |
| Percent share | 56% | 7% | 0% | 2%/td> | 13% | 10% | 8% | 4% | 100% |
| Source: U.S. Energy Information Administration, based on Ministry of Statistics and Programme Implementation, Energy Statistics 2020 and Central Electricity Authority, Annual Report 2018–19. | |||||||||
Electricity demand
Like other large, geographically and economically diverse countries, electricity demand varies across states and regions in India. The grid regions in India differ in several aspects, including their climates, as well as the relative composition between residential, commercial, and industrial electricity consumption. The differences in climate lead to varying seasonal, and even daily, electricity demand patterns or load shapes. For example, in the Northern Region and Eastern Region, demand mostly peaks in the early evening hours (Figure 2). The Western Region, on the other hand, experiences two daily peaks—one during mid-morning hours and one during early-evening hours. Demand in the Southern Region is relatively stable throughout the day.
Figure 2. India figurative daily electricity demand pattern by region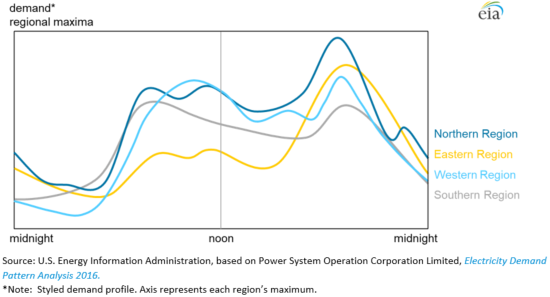
In general, each region has enough generating capacity to satisfy regional needs. However, given sufficient transmission capacity, regions with lower demand periodically generate and transmit electricity to regions with higher demand. Currently, the four largest regions exchange electricity among themselves.[4] According to the Government of India’s Electricity Demand Pattern Analysis 2016, the Northern Region often experiences energy shortages and must import electricity from other regions to fulfill its electricity demand, even with hydropower and coal-fired assets in the region. Both the Western Region and the Southern Region have high industrial and agricultural loads and import from the Eastern Region to meet their respective power deficits during periods of high demand. The Eastern Region has interregional connection to all the regions and is mostly a power-exporting region because it has excess supply after meeting its in-region demand.
Case Descriptions
The International Energy Outlook 2020 (IEO2020) analysis is based on the IEO2019 modeling platform. For IEO2020, the electricity supply component model (the International Electricity Market Module, IEMM) includes updated renewables targets, revised costs for certain fuel-region combinations, and updated representations of market dynamics in select regions.[5] Because IEO2020 is based on the IEO2019 modeling platform and because it focuses on long-term electricity market dynamics, it does not include the impacts that efforts to stop the spread of the novel coronavirus (COVID-19) have had on energy markets.
The analyzed cases incrementally increase the geographical detail to represent the regional power grid-level structure to capture the impact of interregional electricity trade on capacity expansion decisions and the electricity generation fuel mix. We examined five study cases, as summarized in Table 2.
| Scenario | Description | |||
|---|---|---|---|---|
| Case 1—Single Region | India is modeled as a single region, like in IEO2019 (for example, unlimited interregional trade at no cost), but we updated the model to include the most recent renewable targets. | |||
| Case 2—Regional: Single Load Shape | India has five regional power markets. Electricity trade is permitted among all states and regions without limits, after accounting for transmission build costs and losses. We updated natural gas prices in the model to reflect a more up-to-date outlook for the liquefied natural gas market. | |||
| Case 3—Regional: Varied Load Shape | This case includes the same input assumptions as in Case 2, except we applied region-specific demand load shapes. | |||
| Case 4—Regional: Varied Load hape—Demand Growth | This case includes the same input assumptions as in Case 3, except we assumed higher demand at certain times of day to examine India’s resource adequacy, particularly for the regions exporting electricity. | |||
| Case 5—Regional: Restricted Trade | This case includes the same input assumptions as in Case 4, except we eliminated interregional electricity trades. Electricity trade is only allowed between the states in the same region. | |||
Cases 2, 3, and 4 allow the regions to expand transmission infrastructure, assuming the expansion is cost effective. Our assumption of no interregional transmission in Case 5 provides a bounding sensitivity to assess the impact of trade on modeled generation, capacity expansion decisions, and the related fuel consumption.
Case 1—Single Region
Case 1 represents India as a single region, and we updated India’s renewable targets from those in IEO2019 to the renewable targets announced in 2019. Wind, solar, and hydro resources are specified at the state level and then aggregated to the national level so that these resources are available across the entire country. However, Case 1 does not have an interregional transmission limit (that is, perfect connectivity), so we can compare it to India’s single, unified electricity market as assumed in the IEO2019 Reference case. Case 1 assumes that electricity demand by the end-use sectors will be met by marketed electricity from the central grid.[6]
Case 2—Regional: Single Load Shape
Instead of assuming a single, unified electric power grid as in Case 1, Case 2 models India as five separate power grids. Electricity trade occurs without any physical limitations, although the model takes into account the incremental costs to add transmission capability and transmission losses. As a simplified demand assumption, we assume each grid region has the same distribution of demand across the consuming sectors, and we applied the same national load shape across all five electric grids. Coal and natural gas prices are different for each region, reflecting the cost to transport the fuels to power plants across India while retaining the average national fuel cost. We assumed Northeastern Region and Northern Region have higher delivered coal prices than the national average and the Northern Region, Western Region, and Southern Region have higher delivered natural gas prices than the national average. We revised natural gas prices from Case 1 (and IEO2019) to reflect the most recent developments in the liquefied natural gas market in India. Renewable resources such as wind, solar, and hydro are presented on a regional basis.
Case 3—Regional: Varied Load Shape
In Case 3, India is modeled at the same five-grid level as in Case 2, except each region has its own cost for generating technologies and has variations in their seasonal and daily electricity demand. The effects of different load shapes can be compared with Case 2, where we assumed a national load shape to represent all regions. The load shapes are differentiated so that the annual demand remains unchanged, but we revised the patterns in the daily and seasonal consumption to represent India’s regional patterns.
Case 4—Regional: Varied Load Shape—Demand Growth
To capture the potential for electricity trade to meet growing demand, Case 4 examines India’s resource adequacy (the availability of enough generating capacity to meet demand) during peak periods of much higher demand and examines whether increased interregional electricity trade can serve as an alternative source of supply. The regional load shapes are based on the assumptions in Case 3, except we revised the load shapes of importing regions[7] to be higher during peak periods and lower during other periods so that total annual demand remains unchanged.
Case 5—Regional: Restricted Trade
To quantify the impact of interregional trade on the electricity generation mix, Case 5 includes the Case 4 assumptions but restricts electricity trade between the five regional power markets. Electricity trade is only allowed between states within the same region.
Results and Discussion
Modeling India at a subnational level
The projected electricity generation mix in Case 1, where India is modeled as single, unified power market with perfect connectivity, and Case 2, where India is modeled as five separate power regions with unlimited electricity trade but differing regional fuel prices and renewable resources, are different (Figure 3). In Case 1, renewable resources are accessible across India’s single region without any consideration of transmission build costs and losses, which encourages higher share of low-cost renewables (particularly solar). The share of solar generation increases from 3% of the total generation in 2019 to 52% in 2050. In Case 2, renewable resource distributions among the power regions, along with transmission build costs and losses, lessen the renewable generation growth, particularly solar, which increases to 42% of the total generation by 2050. With less availability of renewable generation, the share of coal generation of 35% by 2050 in Case 2 is higher than the 27% in Case 1. Even with some differences, the Case 2 subnational-level results can be used to compare the subsequent cases in this analysis, which are also modeled using the five-grid regional representation to better capture the underlying market economics.
Figure 3. Share of India’s electricity generation in Cases 1 and 2 (2019, 2030, and 2050)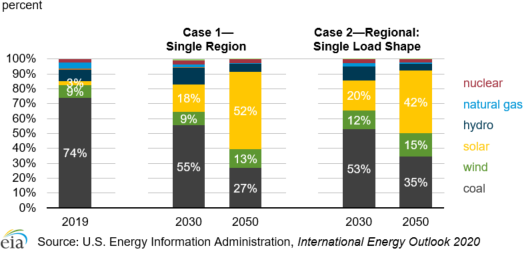
Impact of regional demand patterns
Adding differentiated regional load shapes in Case 3, each with its own variation in daily and seasonal patterns, shifts the share of electricity generation compared with the level in Case 2 (Figure 4). Solar generation grows from 3% of total generation in 2019 to 62% of total generation by 2050, which is higher than the 42% level seen in Case 2. During the same period, coal generation in Case 3 declines from 73% of total generation to 20%, compared with 35% in Case 2.
Figure 4. Share of India’s electricity generation in Cases 2 and 3 (2019, 2030, and 2050)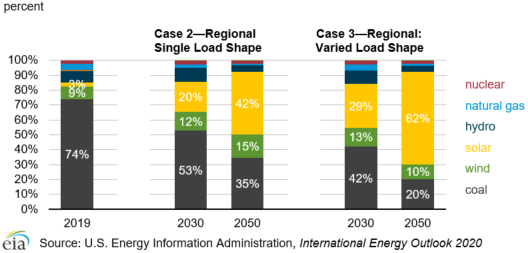
Electricity trading activity is projected to decline over the projection horizon, from 2019 to 2050, in Case 2, which suggests little incentive to trade electricity from one region to another under the case assumptions. The assumed differences in fuel costs to electric generators are not enough to be cost effective for a region with lower generation costs to generate excess electricity to export to a region with higher generation costs. Each region builds new capacity to meet in-region demand, and consumption peaks across each region at the same time. The differentiation in the timing of consumption in Case 3 encourages electricity trading because electricity can be transmitted from a region with lower demand to a region with higher demand during a given period.
With Case 3’s region-specific demand patterns, interregional electricity trading grows between 2019 and 2050. Solar and battery storage are added to the generating capacity mix to satisfy both in-region and interregional demand. Solar and battery storage are economically competitive to meet demand across all periods because solar generation is available to meet daytime demand, and battery storage meets demand when solar generation is not available. The availability of lower-cost solar generation results in less coal generation during the daytime in Case 3 compared with Case 2. Higher deployment of storage—charging during daytime and discharging during peak and night periods—further contributes to less electricity generation from coal and wind in Case 3 than in Case 2. Electricity trade across the five regions nearly doubles over the projection horizon as a result of the differences in regional load shapes adopted for Case 3.
Analysis of India’s resource adequacy
One way to estimate the effect of reliability-related electricity demand is to analyze India’s resource adequacy, or the availability of sufficient generating capacity to meet demand. For Case 4, EIA assumes significant increases in demand during peak hours (7:00 p.m. to 8:59 p.m.) for the regions that are currently importing electricity, about four times higher in the Northern Region and more than two times higher in the Southern Region, compared with the assumptions in Case 3. EIA models resource adequacy by assuming that reliability of the transmission system and the capability to generate electricity dictates an increase in the generating capacity reserve margin to allow additional generation to satisfy the demand of the importing regions.
Changes in demand relative to available capacity stimulate more electricity trade between regions. The growth in interregional electricity trade in Case 4 is more than two times greater than the growth in Case 3 between 2019 and 2050. The incremental increase in demand is met by an increase in solar generation as well as battery storage deployment. Increased availability of solar generation results in less coal generation during the daytime, and greater deployment of battery storage further contributes to less electricity generation from coal and wind when solar generation is not available.
Under the Case 4 assumptions, we project India to have an even higher share of solar generation compared with Case 3 (Figure 5), increasing from 62% of total generation in Case 3 to 67% in Case 4 by 2050. Coal generation decreases to a lower share in Case 4 compared with Case 3, dropping to 15% of total generation. In addition to battery storage, we project natural gas generation in Case 4 to be 61% higher than in Case 3 by 2050 as a result of additional generating capacity installations of both combined-cycle and combustion turbine power plants. These additions ensure resource adequacy in the daytime to meet demand across the five power regions of India in the absence of coal generation.
Figure 5. Share of India electricity generation in Cases 3 and 4 (2019, 2030, and 2050)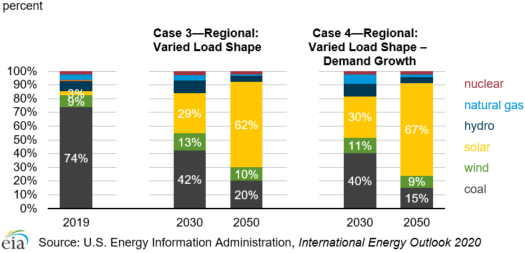
Impact of interregional electricity trade
Because interregional transmission in India has a range of potential futures (ranging from the current state of the transmission system to a potentially more connected system as analyzed in Case 4), we have eliminated the capability to trade electricity among the regions in Case 5 to bound the impact of interregional electricity trade on the generating fuel mix. Under this assumption, less solar generation is projected than in Case 4 because solar is no longer needed to generate electricity for trading (Figure 6). The share of coal generation is higher in Case 5; however, it still declines between 2019 and 2050 because solar and wind are more cost competitive than coal to meet incremental demand over the projection horizon.
When Cases 2 and 5 are compared, solar generation in Case 5 is still greater than in Case 2 because the higher peak demand assumptions present the opportunity for solar to generate during the daytime and for battery storage to discharge during peak periods and at night. Coal generation comprises a larger share of the total generation mix in Case 2 than in Case 5, which suggests that coal generation is sufficient to meet demand across all periods, when regional demand is undifferentiated, as assumed in Case 2.
Figure 6. Share of India electricity generation in Cases 2, 4, and 5 (2019, 2030, 2050)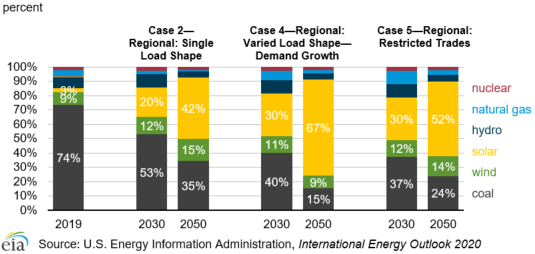
Conclusion
India’s electricity consumption has doubled between 2010 and 2019, and we expect consumption to continue to increase because of projected economic and population growth. Electricity grid interconnections will likely play a role in India’s plan to increase its generating and transmission capacity, especially in the interrelationship between existing coal capacity and renewable capacity additions.
To analyze the impact of interregional electricity trade on capacity expansion decisions that affect the generation fuel mix, EIA modeled India’s power grid at a five-grid regional level. EIA further refined the analysis by applying region-specific generation costs and electricity demand patterns for India’s electricity markets to improve the representation of the underlying economic factors at work in the market.[8] The results suggest that modeling India as a single, unified power market (Case 1) and as five regional power markets (Case 2) produces some differences in the electricity generation fuel mix because access to renewable resources in Case 1 is not constrained by intermittency limits, lending to greater growth of low cost generation, particularly solar. With differentiated costs and load shapes (Case 3), electricity trade occurs across the five power markets modeled. The most cost-competitive generating technologies, such as solar and wind, replace technologies using fossil fuels in the electricity generation mix.
Furthermore, EIA finds that India’s grid reliability requirements (represented as a change in resource adequacy, causing higher levels of peak period demand in Case 4) stimulate even higher levels of interregional electricity trade when compared with Cases 2 and 3. The results confirm higher levels of interregional trade along with higher levels of solar generation during the daytime with storage deployment during peak periods and at night. These results suggest that solar and storage together ensure resource adequacy in India’s power markets under the assumption of higher levels of demand during peak periods. However, in the absence of interregional trading capability (Case 5), the share of generation from solar is lower while the generation shares of coal and wind resources are higher, assuming the same patterns of demand. Natural gas-fired generation and storage deployment increases under this scenario to ensure resource adequacy in the absence of interregional electricity trade.
Compared with Cases 4 and 5, the undifferentiated load shapes in Case 2 provide a lower projection of solar generation and a higher projection of coal generation. EIA will further examine these interactions during the development of IEO2021 to determine the best representation of India’s electric power markets in WEPS.
Back to topEndnotes
- Asia Development Bank. India: National Grid Improvement Project
- Central Statistics Office, Ministry of Statistics and Programme, Energy Statistics 2019.
- Central Statistics Office, Ministry of Statistics and Programme, Energy Statistics 2019.
- Central Statistics Office, Ministry of Power, Annual Report 2018-19.
- EIA’s international modeling system (World Energy Projection System, or WEPS) for IEO2020 also includes a simplified representation of the Global Hydrocarbon Supply Module (GHySMo), which projects the global supplies and prices of liquid and natural gas hydrocarbon fuels. For the IEO2020 Issues in Focus analyses discussing Asia and India, all cases also include an updated representation of Africa’s geography to reflect two subregions within IEMM.
- In many regions of the world, this representation oversimplifies the reality. Grid-proximate, supplemental generation (for example, diesel generators) can also be significant because of chronic grid reliability issues. However, WEPS does not capture its consumption as electricity.
- Based on data from Power System Operation Corporation Limited, Operational Performance Monthly Report 2020-21.
- EIA does not have a detailed network transmission model of India and does not intend here to model the complexities of network flow on India’s integrated grid.