In the News:
Industrial sector consumption of natural gas falls amid slowing economy
Natural gas consumption in the U.S. industrial sector declined from 25.4 billion cubic feet per day (Bcf/d) in January 2020 to 20.1 Bcf/d in June 2020, according to the U.S. Energy Information Administration’s (EIA) Natural Gas Monthly. Industrial natural gas consumption in June 2020 was nearly 1.0 Bcf/d lower than its year-ago level. The decline in industrial sector natural gas consumption compared with the previous year began in March 2020, amid responses to the coronavirus disease (COVID-19) that resulted in a global economic slowdown. Industrial sector consumption reached its lowest point in May 2020, falling by 8% compared with 2019 levels. May 2020 consumption of natural gas by U.S. industry marked the largest year-over-year decline since July 2009, during the 2007–2009 recession. Before this year, average U.S. industrial natural gas consumption grew 5.4% in 2018 and was relatively flat (growing 0.1%) in 2019.
Beginning in March 2020, efforts to mitigate COVID-19 began in the United States. Responses to the virus, including stay-at-home orders and temporary closings of nonessential businesses, contributed to a slowing U.S. economy. According to the Bureau of Economic Analysis (BEA), the value of goods and services produced in the United States, known as gross domestic product (GDP), decreased by 9.1% in the second quarter of 2020 compared with the same quarter a year ago. A slowing economy as a result of COVID-19 mitigation efforts also affected GDP in the first quarter of 2020, which grew 0.3%. Last year, the U.S. economy grew 2.2%.
According to the September 2020 Short-Term Energy Outlook, EIA expects annual consumption of natural gas by U.S. industries to decline by 4.4% in 2020 and then grow 1.1% in 2021. EIA forecasts U.S. industrial natural gas consumption to increase in 2021 because of expected growth in the overall economy and the natural gas-weighted industrial production index. The index reflects the growth of the underlying manufacturing subsectors and the relative importance of those subsectors to total natural gas consumption.
A recent Today in Energy article provides more information about recent industrial natural gas demand trends.
Overview:
(For the week ending Wednesday, September 23, 2020)
- Natural gas spot price movements are mixed this report week (Wednesday, September 16 to Wednesday, September 23). The Henry Hub spot price fell from $2.06 per million British thermal units (MMBtu) last Wednesday to $1.74/MMBtu yesterday.
- At the New York Mercantile Exchange (Nymex), the price of the October 2020 contract decreased 14¢, from $2.267/MMBtu last Wednesday to $2.125/MMBtu yesterday. The price of the 12-month strip averaging October 2020 through September 2021 futures contracts climbed 3¢/MMBtu to $2.911/MMBtu.
- The net injections to working gas totaled 66 billion cubic feet (Bcf) for the week ending September 18. Working natural gas stocks totaled 3,680 Bcf, which is 16% more than the year-ago level and 12% more than the five-year (2015–19) average for this week.
- The natural gas plant liquids composite price at Mont Belvieu, Texas, fell by 1¢/MMBtu, averaging $4.76/MMBtu for the week ending September 23. The price of ethane fell by 15% as a result of ethylene crackers in the path of Hurricane Laura that remained shuttered, resulting in an oversupply situation. The prices of propane, natural gasoline, and butane rose by 7%, 6%, and 4%, respectively. The price of isobutane remained flat week over week.
- According to Baker Hughes, for the week ending Tuesday, September 15, the natural gas rig count increased by 2 to 73. The number of oil-directed rigs fell by 1 to 179. The total rig count increased by 1, and it now stands at 255.
Prices/Supply/Demand:
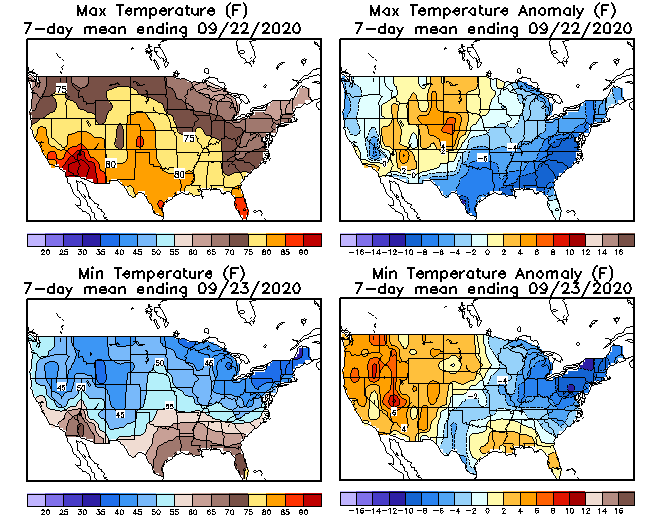
Natural gas movements are mixed. This report week (Wednesday, September 16 to Wednesday, September 23), the Henry Hub spot price fell 32¢ from a high of $2.06/MMBtu last Wednesday to $1.74/MMBtu yesterday after falling to a low of $1.34/MMBtu on Monday. Temperatures across the Lower 48 states were much cooler than normal east of the Rocky Mountains and warmer than normal on the West Coast. At the Chicago Citygate, the price decreased 18¢ from $1.92/MMBtu last Wednesday to $1.74/MMBtu yesterday.
California prices rise. The price at PG&E Citygate in Northern California rose 34¢, up from $3.43/MMBtu last Wednesday to a high of $3.77/MMBtu yesterday. The price at SoCal Citygate in Southern California increased 5¢ from $2.81/MMBtu last Wednesday to $2.86/MMBtu yesterday.
Northeast prices rise with cooler temperatures, but remain relatively low. At the Algonquin Citygate, which serves Boston-area consumers, the price went up 21¢ from $1.25/MMBtu last Wednesday to a high of $1.46/MMBtu yesterday. Temperatures in the Boston area were nearly 65 degrees Fahrenheit and colder further north in New England, leading to possible heating demand. At the Transcontinental Pipeline Zone 6 trading point for New York City, the price increased 32¢ from $0.96/MMBtu last Wednesday to a high of $1.28/MMBtu yesterday.
The Tennessee Zone 4 Marcellus spot price increased 42¢ from $0.81/MMBtu last Wednesday to $1.23/MMBtu yesterday. The price at Dominion South in southwest Pennsylvania rose 36¢ from $0.90/MMBtu last Wednesday to $1.26/MMBtu yesterday.
Permian Basin prices fall. The price at the Waha Hub in West Texas, which is located near Permian Basin production activities, reached a high of $1.52/MMBtu last Wednesday, 54¢/MMBtu lower than the Henry Hub price. Yesterday, the price at the Waha Hub was $1.39/MMBtu, 35¢/MMBtu lower than the Henry Hub price. Storage in the South Central region is 92% full, keeping prices lower than earlier this summer.
Supply falls. According to data from IHS Markit, the average total supply of natural gas fell by 1.2% compared with the previous report week. Dry natural gas production decreased by 0.9% compared with the previous report week. Average net imports from Canada decreased by 10.0% from last week.
Demand rises, driven by use in buildings. Total U.S. consumption of natural gas rose by 1.0% compared with the previous report week, according to data from IHS Markit. Natural gas consumed in the residential and commercial sectors increased by 2.3 Bcf/d, or 27.9%, week over week amid cooler temperatures on the East Coast. Power generation declined by 6.7%. Industrial sector consumption increased by 2.3% week over week. Natural gas exports to Mexico increased 3.9%. Natural gas deliveries to U.S. liquefied natural gas (LNG) export facilities (LNG pipeline receipts) averaged 6.0 Bcf/d, or 1.0 Bcf/d lower than last week. LNG pipeline receipts fell to nearly 4.0 Bcf/d on Tuesday as Tropical Storm Beta moved through the Gulf of Mexico, disrupting LNG tanker movements. Dominion Energy also announced that its Cove Point LNG facility began annual maintenance on September 21.
U.S. LNG exports decrease week over week. Ten LNG vessels (four from Sabine Pass, three from Corpus Christi, two from Cove Point, and one from Freeport) with a combined LNG-carrying capacity of 37 Bcf departed the United States between September 17 and September 23, 2020, according to shipping data provided by Marine Traffic.
Storage:
The net injections into storage totaled 66 Bcf for the week ending September 18, compared with the five-year (2015–19) average net injections of 80 Bcf and last year's net injections of 97 Bcf during the same week. Working natural gas stocks totaled 3,680 Bcf, which is 407 Bcf more than the five-year average and 504 Bcf more than last year at this time.
According to The Desk survey of natural gas analysts, estimates of the weekly net change to working natural gas stocks ranged from net injections of 65 Bcf to 86 Bcf, with a median estimate of 75 Bcf.
The average rate of injections into storage is 6% higher than the five-year average so far in the refill season (April through October). If the rate of injections into storage matched the five-year average of 10.5 Bcf/d for the remainder of the refill season, the total inventory would be 4,130 Bcf on October 31, which is 407 Bcf higher than the five-year average of 3,723 Bcf for that time of year.
More storage data and analysis can be found on the Natural Gas Storage Dashboard and the Weekly Natural Gas Storage Report.
See also:


| Spot Prices ($/MMBtu) | Thu, 17-Sep |
Fri, 18-Sep |
Mon, 21-Sep |
Tue, 22-Sep |
Wed, 23-Sep |
|---|---|---|---|---|---|
| Henry Hub |
1.66 |
1.57 |
1.34 |
1.48 |
1.74 |
| New York |
0.89 |
1.02 |
0.78 |
1.13 |
1.28 |
| Chicago |
1.65 |
1.46 |
1.44 |
1.50 |
1.74 |
| Cal. Comp. Avg.* |
2.51 |
2.29 |
2.54 |
2.60 |
2.76 |
| Futures ($/MMBtu) | |||||
| October contract | 2.042 |
2.048 |
1.835 |
1.834 |
2.125 |
| November contract |
2.577 |
2.633 |
2.710 |
2.597 |
2.794 |
| *Avg. of NGI's reported prices for: Malin, PG&E Citygate, and Southern California Border Avg. | |||||
| Source: NGI's Daily Gas Price Index | |||||


| U.S. natural gas supply - Gas Week: (9/17/20 - 9/23/20) | |||
|---|---|---|---|
Average daily values (Bcf/d): |
|||
this week |
last week |
last year |
|
| Marketed production | 98.3 |
99.1 |
104.7 |
| Dry production | 87.0 |
87.7 |
93.2 |
| Net Canada imports | 3.5 |
3.9 |
4.4 |
| LNG pipeline deliveries | 0.1 |
0.1 |
0.1 |
| Total supply | 90.5 |
91.7 |
97.7 |
|
Source: IHS Markit | |||
| U.S. natural gas consumption - Gas Week: (9/17/20 - 9/23/20) | |||
|---|---|---|---|
Average daily values (Bcf/d): |
|||
this week |
last week |
last year |
|
| U.S. consumption | 62.5 |
61.9 |
63.5 |
| Power | 30.6 |
32.8 |
34.2 |
| Industrial | 21.2 |
20.8 |
20.6 |
| Residential/commercial | 10.6 |
8.3 |
8.6 |
| Mexico exports | 6.0 |
5.7 |
5.6 |
| Pipeline fuel use/losses | 6.5 |
6.5 |
6.9 |
| LNG pipeline receipts | 6.0 |
7.0 |
6.2 |
| Total demand | 81.0 |
81.1 |
82.2 |
|
Source: IHS Markit | |||


| Rigs | |||
|---|---|---|---|
Tue, September 15, 2020 |
Change from |
||
last week |
last year |
||
| Oil rigs | 179 |
-0.6% |
-75.1% |
| Natural gas rigs | 73 |
2.8% |
-50.7% |
| Note: Excludes any miscellaneous rigs | |||
| Rig numbers by type | |||
|---|---|---|---|
Tue, September 15, 2020 |
Change from |
||
last week |
last year |
||
| Vertical | 17 |
-10.5% |
-66.7% |
| Horizontal | 215 |
0.5% |
-71.6% |
| Directional | 23 |
9.5% |
-62.3% |
| Source: Baker Hughes Co. | |||
| Working gas in underground storage | ||||
|---|---|---|---|---|
Stocks billion cubic feet (Bcf) |
||||
| Region | 2020-09-18 |
2020-09-11 |
change |
|
| East | 851 |
825 |
26 |
|
| Midwest | 1,009 |
983 |
26 |
|
| Mountain | 225 |
221 |
4 |
|
| Pacific | 312 |
310 |
2 |
|
| South Central | 1,283 |
1,276 |
7 |
|
| Total | 3,680 |
3,614 |
66 |
|
|
Source: Form EIA-912, Weekly Underground Natural Gas Storage Report | ||||
| Working gas in underground storage | |||||
|---|---|---|---|---|---|
Historical comparisons |
|||||
Year ago (9/18/19) |
5-year average (2015-2019) |
||||
| Region | Stocks (Bcf) |
% change |
Stocks (Bcf) |
% change |
|
| East | 785 |
8.4 |
803 |
6.0 |
|
| Midwest | 924 |
9.2 |
914 |
10.4 |
|
| Mountain | 192 |
17.2 |
201 |
11.9 |
|
| Pacific | 284 |
9.9 |
303 |
3.0 |
|
| South Central | 991 |
29.5 |
1,051 |
22.1 |
|
| Total | 3,176 |
15.9 |
3,273 |
12.4 |
|
| Source: Form EIA-912, Weekly Underground Natural Gas Storage Report | |||||
| Temperature – heating & cooling degree days (week ending Sep 17) | ||||||||
|---|---|---|---|---|---|---|---|---|
HDD deviation from: |
CDD deviation from: |
|||||||
| Region | HDD Current |
normal |
last year |
CDD Current |
normal |
last year |
||
| New England | 33 |
6 |
-2 |
4 |
0 |
1 |
||
| Middle Atlantic | 22 |
3 |
13 |
5 |
-9 |
-12 |
||
| E N Central | 25 |
1 |
21 |
8 |
-7 |
-32 |
||
| W N Central | 36 |
7 |
27 |
12 |
-9 |
-48 |
||
| South Atlantic | 6 |
2 |
6 |
72 |
9 |
-22 |
||
| E S Central | 0 |
-5 |
0 |
75 |
24 |
-31 |
||
| W S Central | 1 |
-1 |
1 |
86 |
2 |
-33 |
||
| Mountain | 20 |
-14 |
6 |
41 |
0 |
-7 |
||
| Pacific | 2 |
-8 |
-3 |
42 |
10 |
3 |
||
| United States | 16 |
-1 |
10 |
40 |
2 |
-20 |
||
|
Note: HDD = heating degree day; CDD = cooling degree day Source: National Oceanic and Atmospheric Administration | ||||||||
Average temperature (°F)
7-day mean ending Sep 17, 2020

Source: National Oceanic and Atmospheric Administration
Deviation between average and normal (°F)
7-day mean ending Sep 17, 2020
Source: National Oceanic and Atmospheric Administration
