In the News:
European Union looks to hydrogen as means of decarbonizing the iron and steel industry
On July 8, 2020, the European Commission (EC) published a document titled A hydrogen strategy for a climate-neutral Europe. In this paper, the EC discusses the potential for hydrogen to support zero-carbon steel making. This strategy follows the March 13, 2020, EC publication of A New Industrial Strategy for Europe, which recognized that some industrial sectors will have to make a “bigger and more transformative change than most” and expressed support for breakthrough technologies leading to a zero-carbon steel making process. The 27 member states of the European Union (EU-27) aim to be greenhouse gas (GHG)-neutral by 2050, which is a European Green Deal objective and also supports the EU’s commitment under the Paris Agreement.
Iron and steel production accounted for 4% of EU-27’s greenhouse gas (GHG) emissions in 2018, according to the latest data from Eurostat. Although aggregate EU-27 emissions have been declining on average by 1% per year, GHG emissions have remained fairly flat in the iron and steel industry, which requires process heat and combusted fuels that are difficult to displace with carbon-free alternatives.
The EU iron and steel industry consumed 2.3 quadrillion British thermal units (Btu) of energy in 2018, according to Eurostat. Of this, 65% was solid fuels, almost exclusively coal. Both coal and natural gas serve as fuel for the smelting of iron ore in basic oxygen furnaces (BOFs) to produce virgin steel. Fossil fuels serve as a source of process heat and also as a reducing agent to process iron from iron ore. Compared with the BOF process that uses only some scrap steel, electric arc furnaces (EAF) are solely dependent on scrap steel to manufacture steel and special steel alloys. Although the EAF process is electric and could be decarbonized with the use of renewably generated electricity, it does require scrap steel that is currently produced exclusively with the use of fossil fuels.
The EC hydrogen strategy sets a goal to produce 10 million metric tons (approximately 1.2 quadrillion Btu) of hydrogen annually by 2030, to be deployed across various industries, including iron and steel. Some European companies are moving toward hydrogen ahead of the 2030 target, however. In Sweden and Austria, companies are building pilot plants that will employ a hydrogen-fed direct reduced iron (DRI) process that will yield iron suitable for use in an EAF, resulting in steel produced without the use of a blast furnace and without direct consumption of fossil fuels. Both the SSAB plant in Sweden and the Primetals Technologies plant in Austria are expected to be completed by the end of 2020. In April 2020 Swedish steel manufacturer Ovako successfully used hydrogen in its steel hot-rolling process—the last step in steel production before the steel is delivered to consumers such as automobile or appliance manufacturers.
Overview:
(For the week ending Wednesday, August 19, 2020)
- Natural gas spot price movements were mixed this report week (Wednesday, August 12 to Wednesday, August 19). The Henry Hub spot price rose from $2.06 per million British thermal units (MMBtu) last Wednesday to $2.36/MMBtu yesterday.
- At the New York Mercantile Exchange (Nymex), the price of the September 2020 contract increased 27¢, from $2.152/MMBtu last Wednesday to $2.426/MMBtu yesterday. The price of the 12-month strip averaging September 2020 through August 2021 futures contracts climbed 15¢/MMBtu to $2.866/MMBtu.
- The net injections to working gas totaled 43 billion cubic feet (Bcf) for the week ending August 14. Working natural gas stocks totaled 3,375 Bcf, which is 21% more than the year-ago level and 15% more than the five-year (2015–19) average for this week.
- The natural gas plant liquids composite price at Mont Belvieu, Texas, rose by 14¢/MMBtu, averaging $5.18/MMBtu for the week ending August 19. The prices of ethane, butane, and natural gasoline rose by 9%, 3%, and 2%, respectively. The price of propane and isobutane each fell by 1%.
- According to Baker Hughes, for the week ending Tuesday, August 11, the natural gas rig count increased by 1 to 70. The number of oil-directed rigs fell by 4 to 172. The total rig count decreased by 3, and it now stands at 244.
Prices/Supply/Demand:
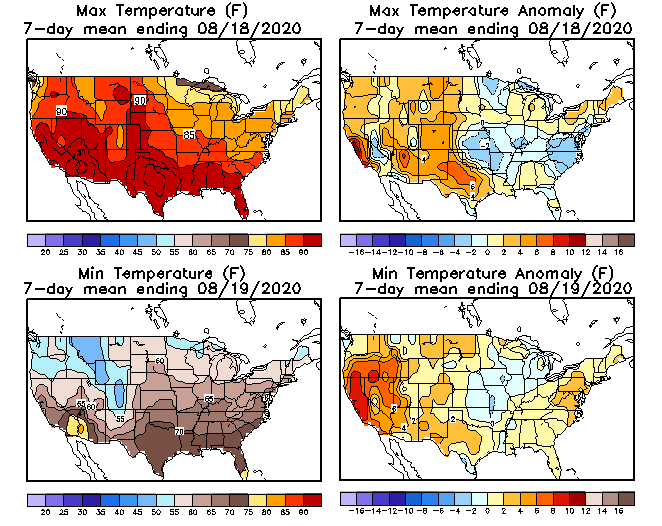
Prices are mixed with high temperatures and wildfires in the West. This report week (Wednesday, August 12 to Wednesday, August 19), the Henry Hub spot price rose 30¢ from a low of $2.06/MMBtu last Wednesday to $2.36/MMBtu yesterday. Temperatures were close to or cooler than normal in the East, and warmer than normal in the West. At the Chicago Citygate, the price increased 31¢ from a low of $1.92/MMBtu last Wednesday to a high of $2.23/MMBtu yesterday.
California prices are up with heat and high demand. The California ISO (CAISO) has been issuing a series of flex alerts since Friday, calling for statewide electricity conservation because of high temperatures and demand for air conditioning amid wildfires. Strong power demand, temporary declines in wind generation, and a 470-megawatt natural gas power plant that unexpectedly went offline contributed to CAISO enacting rotating power outages on Friday and Saturday. EIA’s Hourly Electric Grid Monitor shows the effects of shutoff events.
The price at SoCal Citygate in Southern California more than doubled, increasing $3.12 from $3.03/MMBtu last Wednesday to $6.15/MMBtu yesterday, reaching a high of $13.26/MMBtu on Monday. High temperatures have resulted in natural gas net withdrawals from storage during the report week. The price at PG&E Citygate in Northern California rose 48¢, up from a low of $2.83/MMBtu last Wednesday to $3.31/MMBtu yesterday.
Northeast prices fall on cooler weather. At the Algonquin Citygate, which serves Boston-area consumers, the price went down 37¢ from a high of $1.68/MMBtu last Wednesday to $1.31/MMBtu yesterday as cooler-than-normal temperatures limited power demand. At the Transcontinental Pipeline Zone 6 trading point for New York City, the price decreased 52¢ from a high of $1.71/MMBtu last Wednesday to a low of $1.19/MMBtu yesterday.
The Tennessee Zone 4 Marcellus spot price decreased 9¢ from $1.16/MMBtu last Wednesday to $1.07/MMBtu yesterday. The price at Dominion South in southwest Pennsylvania fell 2¢ from $1.16/MMBtu last Wednesday to $1.14/MMBtu yesterday.
Permian Basin basis to Henry Hub widens. The price at the Waha Hub in West Texas, which is located near Permian Basin production activities, averaged $1.61/MMBtu last Wednesday, 45¢/MMBtu lower than the Henry Hub price. Yesterday, the price at the Waha Hub averaged $1.65/MMBtu, 71¢/MMBtu lower than the Henry Hub price.
Supply is down slightly. According to data from IHS Markit, the average total supply of natural gas fell by 0.2% compared with the previous report week. Dry natural gas production decreased by 0.1% compared with the previous report week. Average net imports from Canada decreased by 1.2% from last week.
Demand rises across all sectors. Total U.S. consumption of natural gas rose by 1.5% compared with the previous report week, according to data from IHS Markit. Natural gas consumed for power generation climbed by 1.8% week over week. In the residential and commercial sectors, consumption increased by 1.4%. Industrial sector consumption increased by 1.0% week over week. Natural gas exports to Mexico increased 0.6%.
U.S. LNG exports increase week over week. Eleven liquefied natural gas (LNG) vessels (four from Sabine Pass, three from Cameron, two from Cove Point, and one each from Freeport and Corpus Christi) with a combined LNG-carrying capacity of 40 Bcf departed the United States between August 13 and August 19, 2020, according to shipping data provided by Marine Traffic.
Storage:
The net injections into storage totaled 43 Bcf for the week ending August 14, compared with the five-year (2015–19) average net injections of 44 Bcf and last year's net injections of 56 Bcf during the same week. Working natural gas stocks totaled 3,375 Bcf, which is 442 Bcf more than the five-year average and 595 Bcf more than last year at this time.
According to The Desk survey of natural gas analysts, estimates of the weekly net change to working natural gas stocks ranged from net injections of 34 Bcf to 51 Bcf, with a median estimate of 43 Bcf.
The average rate of injections into storage is 11% higher than the five-year average so far in the refill season (April through October). If the rate of injections into storage matched the five-year average of 10.1 Bcf/d for the remainder of the refill season, the total inventory would be 4,165 Bcf on October 31, which is 442 Bcf higher than the five-year average of 3,723 Bcf for that time of year
More storage data and analysis can be found on the Natural Gas Storage Dashboard and the Weekly Natural Gas Storage Report.
See also:


| Spot Prices ($/MMBtu) | Thu, 13-Aug |
Fri, 14-Aug |
Mon, 17-Aug |
Tue, 18-Aug |
Wed, 19-Aug |
|---|---|---|---|---|---|
| Henry Hub |
2.12 |
2.21 |
2.32 |
2.37 |
2.36 |
| New York |
1.47 |
1.32 |
1.53 |
1.42 |
1.19 |
| Chicago |
2.04 |
2.11 |
2.16 |
2.22 |
2.23 |
| Cal. Comp. Avg.* |
2.97 |
3.70 |
5.14 |
3.58 |
3.37 |
| Futures ($/MMBtu) | |||||
| September contract | 2.182 |
2.356 |
2.339 |
2.417 |
2.426 |
| October contract |
2.324 |
2.495 |
2.476 |
2.556 |
2.563 |
| *Avg. of NGI's reported prices for: Malin, PG&E Citygate, and Southern California Border Avg. | |||||
| Source: NGI's Daily Gas Price Index | |||||


| U.S. natural gas supply - Gas Week: (8/13/20 - 8/19/20) | |||
|---|---|---|---|
Average daily values (Bcf/d): |
|||
this week |
last week |
last year |
|
| Marketed production | 101.2 |
101.3 |
105.9 |
| Dry production | 89.5 |
89.6 |
93.0 |
| Net Canada imports | 4.9 |
4.9 |
4.6 |
| LNG pipeline deliveries | 0.1 |
0.2 |
0.1 |
| Total supply | 94.5 |
94.7 |
97.7 |
|
Source: IHS Markit | |||
| U.S. natural gas consumption - Gas Week: (8/13/20 - 8/19/20) | |||
|---|---|---|---|
Average daily values (Bcf/d): |
|||
this week |
last week |
last year |
|
| U.S. consumption | 70.4 |
69.4 |
72.4 |
| Power | 41.2 |
40.5 |
43.3 |
| Industrial | 20.7 |
20.5 |
21.3 |
| Residential/commercial | 8.5 |
8.4 |
7.8 |
| Mexico exports | 5.6 |
5.6 |
5.5 |
| Pipeline fuel use/losses | 6.9 |
6.8 |
6.6 |
| LNG pipeline receipts | 4.7 |
4.4 |
4.3 |
| Total demand | 87.6 |
86.2 |
88.8 |
|
Source: IHS Markit | |||


| Rigs | |||
|---|---|---|---|
Tue, August 11, 2020 |
Change from |
||
last week |
last year |
||
| Oil rigs | 172 |
-2.3% |
-77.7% |
| Natural gas rigs | 70 |
1.4% |
-57.6% |
| Note: Excludes any miscellaneous rigs | |||
| Rig numbers by type | |||
|---|---|---|---|
Tue, August 11, 2020 |
Change from |
||
last week |
last year |
||
| Vertical | 13 |
8.3% |
-75.0% |
| Horizontal | 207 |
-1.9% |
-74.6% |
| Directional | 24 |
0.0% |
-64.7% |
| Source: Baker Hughes Co. | |||
| Working gas in underground storage | ||||
|---|---|---|---|---|
Stocks billion cubic feet (Bcf) |
||||
| Region | 2020-08-14 |
2020-08-07 |
change |
|
| East | 750 |
738 |
12 |
|
| Midwest | 880 |
856 |
24 |
|
| Mountain | 209 |
206 |
3 |
|
| Pacific | 313 |
314 |
-1 |
|
| South Central | 1,223 |
1,219 |
4 |
|
| Total | 3,375 |
3,332 |
43 |
|
|
Source: Form EIA-912, Weekly Underground Natural Gas Storage Report | ||||
| Working gas in underground storage | |||||
|---|---|---|---|---|---|
Historical comparisons |
|||||
Year ago (8/14/19) |
5-year average (2015-2019) |
||||
| Region | Stocks (Bcf) |
% change |
Stocks (Bcf) |
% change |
|
| East | 653 |
14.9 |
688 |
9.0 |
|
| Midwest | 751 |
17.2 |
757 |
16.2 |
|
| Mountain | 167 |
25.1 |
184 |
13.6 |
|
| Pacific | 273 |
14.7 |
293 |
6.8 |
|
| South Central | 936 |
30.7 |
1,012 |
20.8 |
|
| Total | 2,780 |
21.4 |
2,933 |
15.1 |
|
| Source: Form EIA-912, Weekly Underground Natural Gas Storage Report | |||||
| Temperature – heating & cooling degree days (week ending Aug 13) | ||||||||
|---|---|---|---|---|---|---|---|---|
HDD deviation from: |
CDD deviation from: |
|||||||
| Region | HDD Current |
normal |
last year |
CDD Current |
normal |
last year |
||
| New England | 0 |
-3 |
-1 |
77 |
37 |
38 |
||
| Middle Atlantic | 0 |
-3 |
-1 |
79 |
25 |
28 |
||
| E N Central | 2 |
-3 |
0 |
58 |
7 |
8 |
||
| W N Central | 0 |
-3 |
-2 |
72 |
8 |
9 |
||
| South Atlantic | 0 |
0 |
0 |
109 |
16 |
-1 |
||
| E S Central | 0 |
0 |
0 |
100 |
10 |
-8 |
||
| W S Central | 0 |
0 |
0 |
141 |
18 |
-9 |
||
| Mountain | 0 |
-3 |
0 |
84 |
13 |
6 |
||
| Pacific | 2 |
0 |
2 |
51 |
5 |
2 |
||
| United States | 1 |
-2 |
0 |
85 |
15 |
7 |
||
|
Note: HDD = heating degree day; CDD = cooling degree day Source: National Oceanic and Atmospheric Administration | ||||||||
Average temperature (°F)
7-day mean ending Aug 13, 2020

Source: National Oceanic and Atmospheric Administration
Deviation between average and normal (°F)
7-day mean ending Aug 13, 2020
Source: National Oceanic and Atmospheric Administration
