Notice of holiday release schedule for Natural Gas Weekly Update (NGWU):
The next NGWU will be released on January 9, 2020, because of upcoming federal holidays.
In the News:
European LNG imports are at record levels this year
Europe’s imports of liquefied natural gas (LNG) have been steadily increasing since October 2018, and reached a new monthly record of 12.7 billion cubic feet per day (Bcf/d) in November 2019, according to the U.S. Energy Information Administration (EIA) estimates based on Bloomberg Finance L.P. tanker shipment data. This monthly record implies a 51% utilization of Europe-wide regasification capacity (including Turkey). From January through November 2019, LNG imports into Europe averaged 11 Bcf/d—the highest level for European LNG imports—surpassing the previous record of 8 Bcf/d (annual average) set in 2011. Lower spot LNG prices in Asia have narrowed the price differentials between delivering LNG to Asia or to Europe and have contributed to increased cargo shipments to Europe.
LNG imports into Europe have been relatively low in recent years. This year, however, spot natural gas prices in Europe declined to a 10-year low, providing incentives for increased electric generation from natural gas-fired power plants. Strong demand growth in the power generation sector combined with declining natural gas production in the United Kingdom and the Netherlands, required larger volumes of natural gas imports by both pipeline and as LNG. Lower natural gas demand in Asia has freed up more destination-flexible LNG cargoes that were shipped to Europe.
This year, three LNG suppliers to Europe—Qatar, the United States, and Russia—have increased their LNG exports to the region by a combined 3.7 Bcf/d in the first 11 months of 2019, compared with LNG exports to Europe by these suppliers in 2018 (annual average). The United States had the largest increase, with LNG exports growing from 0.4 Bcf/d in 2018 to 1.8 Bcf/d in the first 11 months of 2019, followed by Russia (1.3 Bcf/d increase), and Qatar (1.0 Bcf/d increase). Other suppliers to Europe, including Nigeria, Trinidad & Tobago, and Algeria, increased LNG exports by 0.3 Bcf/d each in 2019 (January–November) compared with the annual average for 2018.
Major Asian LNG consumers—Japan, China, South Korea, and India (accounting for 65% of global LNG imports in 2018)—imported an estimated 26.1 Bcf/d of LNG between January and November 2019, 0.7 Bcf/d (3%) less than in all of 2018. In particular
Both Japan and South Korea reduced LNG imports by an estimated 0.8 Bcf/d and 0.6 Bcf/d, respectively, in January–November 2019. In Japan, natural gas consumption was affected by lower demand for natural gas-fired generation following the restart of five nuclear reactors and increased generation from renewable sources, particularly solar. Similarly, in South Korea, LNG imports decreased as a result of higher generation from nuclear units (several of which were restarted in 2019 after an extended maintenance period last year), higher generation from the renewables, and an overall lower electricity demand.
- LNG imports in China, after growing by more than 40% from 2017 to 2018, experienced a slower growth from January through November 2019. Slowing economy and warm weather have negatively impacted LNG imports in October–November 2019, the peak LNG buying season.
- Although LNG imports in India remained flat in 2019, imports are likely to increase next year once the new regasification terminals and connecting pipelines are placed in service.
Overview:
(For the week ending Wednesday, December 18, 2019)
- Natural gas spot prices rose at most locations this report week (Wednesday, December 11 to Wednesday, December 18). The Henry Hub spot price fell from $2.26 per million British thermal units (MMBtu) last Wednesday to $2.24/MMBtu yesterday.
- At the New York Mercantile Exchange (Nymex), the price of the January 2020 contract increased 4¢, from $2.243/MMBtu last Wednesday to $2.286/MMBtu yesterday. The price of the 12-month strip averaging January 2020 through December 2020 futures contracts climbed 2¢/MMBtu to $2.294/MMBtu.
- The net withdrawal from working gas totaled 107 billion cubic feet (Bcf) for the week ending December 13. Working natural gas stocks total 3,411 Bcf, which is 22% more than the year-ago level and the same as the five-year (2014–18) average for this week.
- The natural gas plant liquids composite price at Mont Belvieu, Texas, fell by 2¢/MMBtu, averaging $5.58/MMBtu for the week ending December 18. The prices of natural gasoline, propane, and isobutane fell by 1%, 1%, and 2%, respectively. The price of butane rose by 4%. The price of ethane remained flat week over week.
- According to Baker Hughes, for the week ending Tuesday, December 10, the natural gas rig count decreased by 4 to 129. The number of oil-directed rigs rose by 4 to 667. The total rig count stayed at 799, the lowest level since March 2017.
Prices/Supply/Demand:
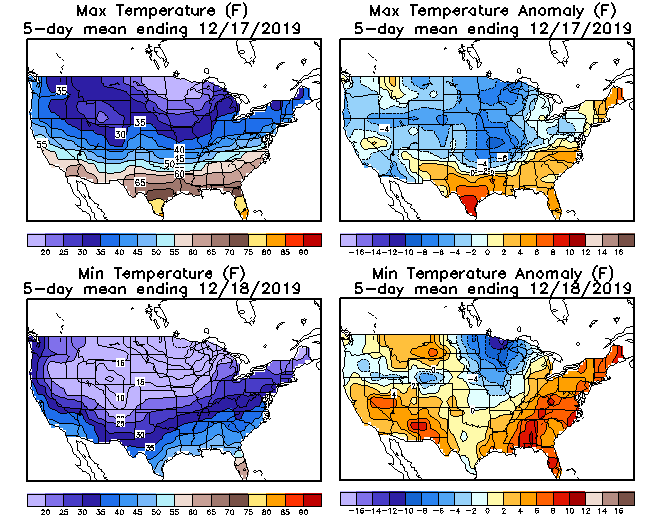
The Henry Hub and Chicago Citygate prices remain relatively unchanged. This report week (Wednesday, December 11 to Wednesday, December 18), the Henry Hub spot price traded within a narrow range and fell 2¢ from $2.26/MMBtu last Wednesday to a low of $2.24/MMBtu yesterday. Temperatures were cooler than normal in the Midwest and warmer than normal across the southern half of the country. At the Chicago Citygate, the price decreased 1¢ from $2.13/MMBtu last Wednesday to a low of $2.12/MMBtu yesterday.
California prices rise. Temperatures across the state were generally close to normal. The price at PG&E Citygate in Northern California rose 27¢, up from $3.21/MMBtu last Wednesday to $3.48/MMBtu yesterday. The price at SoCal Citygate in Southern California increased 30¢ from $5.15/MMBtu last Wednesday to $5.45/MMBtu yesterday as the region made net withdrawals from underground storage four days in a row (Sunday
Northeast prices double amid high demand, cold temperatures. Temperatures across the region were close to freezing at the end of the report week, driving up demand and prices. At the Algonquin Citygate, which serves Boston-area consumers, prices were volatile and rose $9.49 from $4.48/MMBtu last Wednesday to a high of $13.97/MMBtu yesterday as a result of below-normal temperatures forecast for the weekend. At the Transcontinental Pipeline Zone 6 trading point for New York City, the price increased $2.77 from $2.84/MMBtu last Wednesday to a high of $5.61/MMBtu yesterday. Capacity is constrained on the Texas Eastern Transmission pipeline as ongoing pipeline work coincides with cold temperatures.
The Tennessee Zone 4 Marcellus spot price increased 12¢ from $1.79/MMBtu last Wednesday to $1.91/MMBtu yesterday. The price at Dominion South in southwest Pennsylvania rose 6¢ from $1.83/MMBtu last Wednesday to $1.89/MMBtu yesterday.
Discount at Permian Basin trading hub persists. The price at the Waha Hub in West Texas, which is located near Permian Basin production activities, averaged $1.50/MMBtu last Wednesday, 76¢/MMBtu lower than the Henry Hub price. Yesterday, the price at the Waha Hub averaged $1.65/MMBtu, 59¢/MMBtu lower than the Henry Hub price.
Supply is flat. According to data from IHS Markit, the average total supply of natural gas remained the same as in the previous report week, averaging 100.6 Bcf/d. Dry natural gas production decreased by 1% compared with the previous report week. Average net imports from Canada increased by 17% from last week.
Demand rises, driven by power generation and buildings sectors. Total U.S. consumption of natural gas rose by 7% compared with the previous report week, according to data from IHS Markit. Natural gas consumed for power generation climbed by 7% week over week. Industrial sector consumption increased by 5% week over week. In the residential and commercial sectors, consumption increased by 7%. Natural gas exports to Mexico were the same as last week, averaging 5.3 Bcf/d.
U.S. LNG exports increase week over week. Seventeen LNG vessels (eight from Sabine Pass, two each from Corpus Christi, Cove Point, Cameron, and Freeport, and one from Elba Island) with a combined LNG-carrying capacity of 59 Bcf departed the United States between December 12 and December 18, according to shipping data compiled by Bloomberg. Three vessels (one each at Sabine Pass, Corpus Christi, and Freeport) were loading on Wednesday. Elba Island shipped its first LNG export cargo on December 13.
Freeport LNG, which exported its first cargo from the newly commissioned Train 1 in September, started LNG production from Train 2 on December 6 and exported its first cargo from Train 2 on December 18. Freeport LNG Train 3 is currently under construction and is expected to come online in the first quarter of 2020.
Storage:
The net withdrawal from storage totaled 107 Bcf for the week ending December 13, compared with the five-year (2014–18) average net withdrawal of 112 Bcf and last year's net withdrawal of 132 Bcf during the same week. Working natural gas stocks totaled 3,411 Bcf, which is 9 Bcf lower than the five-year average and 618 Bcf more than last year at this time.
According to The Desk survey of natural gas analysts, estimates of the weekly net change to working natural gas stocks ranged from a net withdrawal of 68 Bcf to 103 Bcf, with a median estimate of 95 Bcf.
More storage data and analysis can be found on the Natural Gas Storage Dashboard and the Weekly Natural Gas Storage Report.
See also:

 Sources: Japan on Ministry of Finance, South Korea International Trade Association,
China General Administration of Customs, India Ministry of Petroleum and Natural Gas
Sources: Japan on Ministry of Finance, South Korea International Trade Association,
China General Administration of Customs, India Ministry of Petroleum and Natural Gas Note: Oct. and Nov. 2019 import volumes are estimates of the U.S. Energy Information Administration based on tanker data provided by Bloomberg Finance, L.P.


| Spot Prices ($/MMBtu) | Thu, 12-Dec |
Fri, 13-Dec |
Mon, 16-Dec |
Tue, 17-Dec |
Wed, 18-Dec |
|---|---|---|---|---|---|
| Henry Hub |
2.26 |
2.24 |
2.34 |
2.30 |
2.24 |
| New York |
2.15 |
2.30 |
2.63 |
5.65 |
5.61 |
| Chicago |
2.12 |
2.15 |
2.26 |
2.22 |
2.12 |
| Cal. Comp. Avg.* |
2.77 |
2.77 |
3.31 |
3.74 |
3.53 |
| Futures ($/MMBtu) | |||||
| January contract | 2.328 |
2.296 |
2.341 |
2.319 |
2.286 |
| February contract |
2.320 |
2.282 |
2.326 |
2.303 |
2.264 |
| *Avg. of NGI's reported prices for: Malin, PG&E Citygate, and Southern California Border Avg. | |||||
| Source: NGI's Daily Gas Price Index | |||||


| U.S. natural gas supply - Gas Week: (12/12/19 - 12/18/19) | |||
|---|---|---|---|
Average daily values (Bcf/d): |
|||
this week |
last week |
last year |
|
| Marketed production | 108.8 |
109.4 |
97.4 |
| Dry production | 95.8 |
96.3 |
86.5 |
| Net Canada imports | 4.6 |
3.9 |
4.8 |
| LNG pipeline deliveries | 0.2 |
0.2 |
0.2 |
| Total supply | 100.6 |
100.4 |
91.5 |
|
Source: IHS Markit | |||
| U.S. natural gas consumption - Gas Week: (12/12/19 - 12/18/19) | |||
|---|---|---|---|
Average daily values (Bcf/d): |
|||
this week |
last week |
last year |
|
| U.S. consumption | 97.3 |
91.3 |
88.1 |
| Power | 30.5 |
28.4 |
24.7 |
| Industrial | 24.8 |
23.5 |
24.0 |
| Residential/commercial | 42.0 |
39.4 |
39.4 |
| Mexico exports | 5.3 |
5.3 |
4.8 |
| Pipeline fuel use/losses | 7.4 |
7.3 |
6.7 |
| LNG pipeline receipts | 8.0 |
7.9 |
4.4 |
| Total demand | 118.0 |
111.7 |
104.0 |
|
Source: IHS Markit | |||


| Rigs | |||
|---|---|---|---|
Tue, December 10, 2019 |
Change from |
||
last week |
last year |
||
| Oil rigs | 667 |
0.6% |
-23.6% |
| Natural gas rigs | 129 |
-3.0% |
-34.8% |
| Note: Excludes any miscellaneous rigs | |||
| Rig numbers by type | |||
|---|---|---|---|
Tue, December 10, 2019 |
Change from |
||
last week |
last year |
||
| Vertical | 0 |
0.0% |
0.0% |
| Horizontal | 13 |
-7.1% |
-56.7% |
| Directional | 52 |
0.0% |
-28.8% |
| Source: Baker Hughes Inc. | |||
| Working gas in underground storage | ||||
|---|---|---|---|---|
Stocks billion cubic feet (Bcf) |
||||
| Region | 2019-12-13 |
2019-12-06 |
change |
|
| East | 838 |
867 |
-29 |
|
| Midwest | 973 |
1,013 |
-40 |
|
| Mountain | 186 |
193 |
-7 |
|
| Pacific | 273 |
276 |
-3 |
|
| South Central | 1,142 |
1,168 |
-26 |
|
| Total | 3,411 |
3,518 |
-107 |
|
|
Source: Form EIA-912, Weekly Underground Natural Gas Storage Report | ||||
| Working gas in underground storage | |||||
|---|---|---|---|---|---|
Historical comparisons |
|||||
Year ago (12/13/18) |
5-year average (2014-2018) |
||||
| Region | Stocks (Bcf) |
% change |
Stocks (Bcf) |
% change |
|
| East | 698 |
20.1 |
808 |
3.7 |
|
| Midwest | 847 |
14.9 |
972 |
0.1 |
|
| Mountain | 154 |
20.8 |
193 |
-3.6 |
|
| Pacific | 229 |
19.2 |
305 |
-10.5 |
|
| South Central | 865 |
32.0 |
1,142 |
0.0 |
|
| Total | 2,793 |
22.1 |
3,420 |
-0.3 |
|
| Source: Form EIA-912, Weekly Underground Natural Gas Storage Report | |||||
| Temperature – heating & cooling degree days (week ending Dec 12) | ||||||||
|---|---|---|---|---|---|---|---|---|
HDD deviation from: |
CDD deviation from: |
|||||||
| Region | HDD Current |
normal |
last year |
CDD Current |
normal |
last year |
||
| New England | 229 |
8 |
-37 |
0 |
0 |
0 |
||
| Middle Atlantic | 210 |
0 |
-41 |
0 |
0 |
0 |
||
| E N Central | 232 |
-9 |
-38 |
0 |
0 |
0 |
||
| W N Central | 263 |
-4 |
-20 |
0 |
0 |
0 |
||
| South Atlantic | 135 |
-12 |
-58 |
12 |
4 |
8 |
||
| E S Central | 129 |
-23 |
-62 |
0 |
-1 |
0 |
||
| W S Central | 88 |
-25 |
-43 |
4 |
1 |
4 |
||
| Mountain | 184 |
-36 |
-26 |
0 |
0 |
0 |
||
| Pacific | 93 |
-23 |
-15 |
0 |
-1 |
0 |
||
| United States | 175 |
-14 |
-36 |
3 |
1 |
2 |
||
|
Note: HDD = heating degree day; CDD = cooling degree day Source: National Oceanic and Atmospheric Administration | ||||||||
Average temperature (°F)
7-day mean ending Dec 12, 2019

Source: National Oceanic and Atmospheric Administration
Deviation between average and normal (°F)
7-day mean ending Dec 12, 2019
Source: National Oceanic and Atmospheric Administration
