In the News:
Hurricane activity drives declines in Gulf of Mexico natural gas production
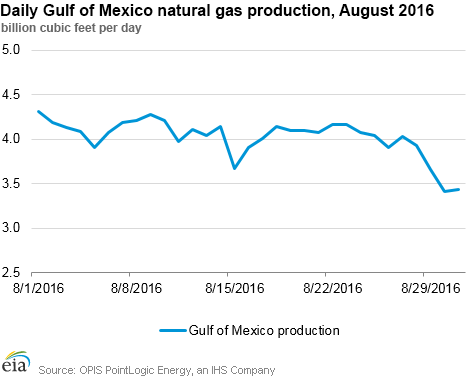
The potential for hurricanes in the Gulf of Mexico led to evacuations of personnel from offshore platforms and declines in Gulf natural gas production this week. Several producers, including Shell, BHP Billiton, Anadarko, and BP plc evacuated nonessential personnel from offshore facilities as a precaution against a tropical disturbance, currently known as Tropical Storm Hermine.
Declines in Gulf of Mexico production over the weekend were mostly concentrated on the Destin pipeline system, a BP subsidiary, according to PointLogic. The Destin pipeline is a major offshore interstate pipeline that receives natural gas produced from several offshore platforms and brings it to a processing plant in Pascagoula, Mississippi, before connecting with other major interstate systems. Two of these systems, Transcontinental and Texas Eastern Transmission, also posted large decreases on Tuesday, as noted by PointLogic.
The storm, which is expected to make landfall on the northeast Gulf Coast this evening, could also lead to reduced consumption of natural gas for power generation, because tropical wind and rain generally lead to cooler temperatures and lower demand for air conditioning.
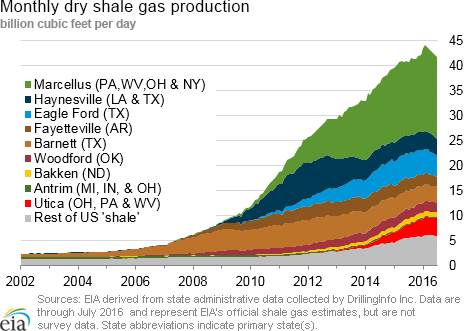
Late August to early September is generally the most active time of hurricane season, and several storm systems are currently forming in the Gulf and Atlantic. While Gulf of Mexico natural gas production has declined substantially over the past several years, it still totaled 3.6 billion cubic feet per day in 2015, or about 4.6% of total U.S. production. EIA monitors tropical activity that could threaten energy infrastructure on its energy disruptions page.
Overview:
(For the Week Ending Wednesday, August 31, 2016)
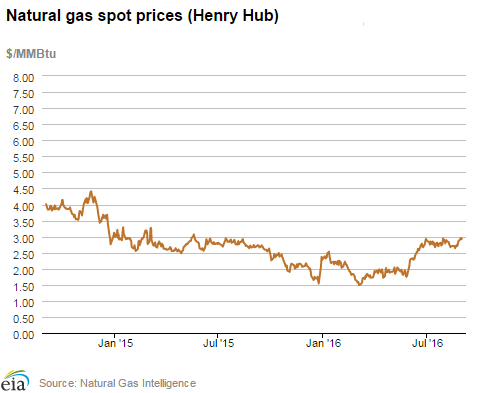
- Natural gas spot prices rose at most locations outside the Northeast this report week (Wednesday, August 24, to Wednesday, August 31). The Henry Hub spot price rose from $2.77 per million British thermal units (MMBtu) last Wednesday to $2.94/MMBtu yesterday.
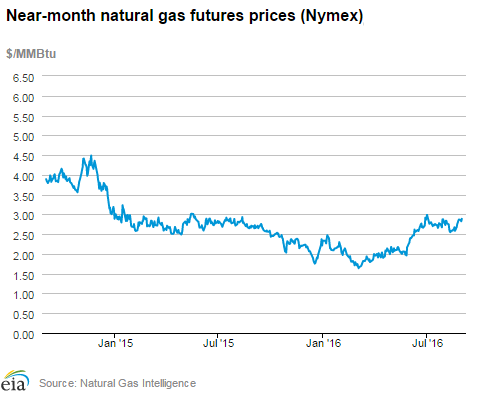
- At the New York Mercantile Exchange (Nymex), the September 2016 contract rose 6¢, from $2.796/MMBtu last Wednesday to settle at $2.853 on Monday. The October 2016 contract moved into front-month position this week, rising 5¢ from $2.835/MMBtu last Wednesday to $2.887 yesterday.
- Net injections to working gas totaled 51 Bcf for the week ending August 26. Working gas stocks are 3,401 Bcf, which is 8% greater than the year-ago level and 11% greater than the five-year (2011-15) average for this week.
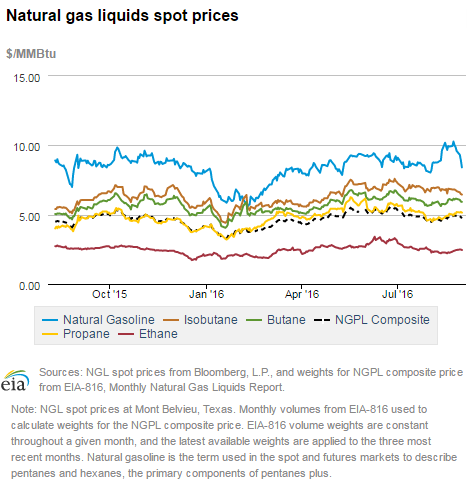
- The natural gas plant liquids composite price at Mont Belvieu, Texas, rose by 12¢, closing at $4.92/MMBtu for the week ending August 26. The price of ethane rose by 7%; the prices of propane and butane both rose by 3%; and the prices of natural gasoline and isobutane were both flat.
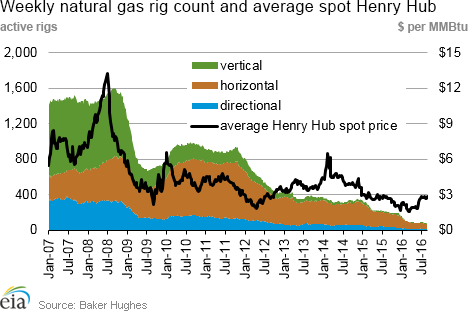
- According to Baker Hughes, for the week ending Friday, August 26, the natural gas rig count fell by 2 to 81. The number of oil-directed rigs remained flat this week at 406. The total rig count fell by 2, and now stands at 489. This week marks the first decline in the rig count after eight consecutive weeks of increases.
Prices/Supply/Demand:
Spot prices rise outside the Northeast. This report week the Henry Hub spot price rose 17¢ from $2.77/MMBtu last Wednesday to $2.94/MMBtu yesterday. Similarly, at the Chicago Citygate, prices increased 14¢ from $2.76/MMBtu last Wednesday to $2.90/MMBtu yesterday. Prices at PG&E Citygate in California rose 12¢, going from $3.25/MMBtu last Wednesday to $3.37/MMBtu yesterday.
Even though temperatures moderated this week and consumption was lower, prices may be receiving upward pressure from production shut-ins in the Gulf of Mexico related to Tropical Storm Hermine. Several offshore platforms were shut-in in anticipation of the storm earlier this week. The Bureau of Safety and Environmental Enforcement reports that 360 MMcf/d of natural gas production was shut-in as of yesterday, which accounts for 11% of Gulf of Mexico natural gas production.
Northeast prices down. At the Algonquin Citygate, which serves Boston-area consumers, prices went down 5¢ from $2.89/MMBtu last Wednesday to $2.84/MMBtu yesterday. At the Transcontinental Pipeline’s Zone 6 trading point for New York, prices decreased 42¢ from $1.81/MMBtu last Wednesday to $1.39/MMBtu yesterday. This is relatively low for the New York price point, likely because of recent mild weather and forecasts for additional mild weather in the near-term.
Marcellus prices down. Tennessee Zone 4 Marcellus spot prices fell 11¢ from $1.34/MMBtu last Wednesday to $1.23/MMBtu yesterday. Prices at Dominion South in northwest Pennsylvania fell 14¢ from $1.36/MMBtu last Wednesday to $1.22/MMBtu yesterday.
Nymex prices rise. At the Nymex, the September 2016 contract rose 6¢, from $2.796/MMBtu last Wednesday to settle at $2.853 on Monday. The October 2016 contract moved into the front-month position this week, rising 5¢ from $2.835/MMBtu last Wednesday to $2.887 yesterday. The 12-month strip (averaging October 2016 to September 2017 contracts) rose 3¢, from $3.068/MMBtu last Wednesday to $3.100 yesterday.
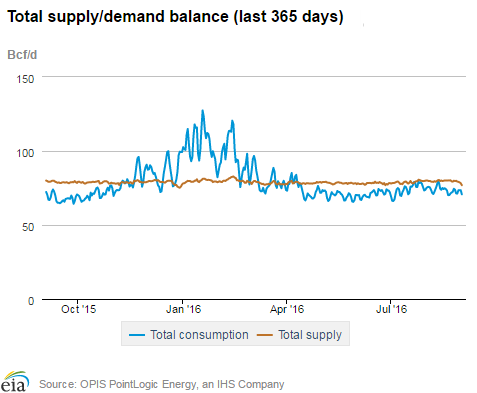
Supply flat. According to data from PointLogic, total supply of natural gas remained the same as last week, averaging 79.3 Bcf/d. Dry production dipped early this week through yesterday, likely related to outages in the Gulf of Mexico. Overall for the week, dry production was down by about half of one percent.
Demand down substantially. During the report week, total U.S. consumption of natural gas fell by 12%, according to data from PointLogic, with decreases in all sources of demand. Power burn declined by 10% week over week as temperatures continued to moderate. Industrial sector consumption fell 14%; and residential and commercial consumption fell by 21%.
U.S. liquefied natural gas (LNG) exports. Natural gas pipeline flows to the Sabine Pass liquefaction terminal averaged 0.7 Bcf/d this report week, 3% lower than flows last week. One vessel (LNG-carrying capacity 3.6 Bcf) departed the Sabine Pass terminal during the report week, and one vessel (LNG-carrying capacity 3.6 Bcf) is currently loading at the terminal.
Storage:
Injections to storage continue at slower-than-normal rate. Net injections into storage totaled 51 Bcf, compared with the five-year (2011-15) average net injections of 67 Bcf and last year’s net injections of 88 Bcf during the same week. Working gas stocks total 3,401 Bcf, 334 Bcf above the five-year average and 238 Bcf above last year at this time. This week marks the 17th consecutive week that the gap of working gas stocks compared with the five-year average declined. When the refill season began on April 1, working gas stocks were 874 Bcf above the five-year average.
South Central Salt region falls below year-ago level for the first time in 2016. The South Central Salt region posted net withdrawals totaling 5 Bcf for the report week, bringing the working gas level to 2 Bcf below its year-ago level. Entering the refill season on April 2016, working gas in the South Central Salt region was 181 Bcf above the year-ago level. Since the beginning of the refill season net withdrawals from storage have totaled 36 Bcf, compared with the five-year average net injection of 71 Bcf and last year’s net injection of 147 Bcf over the same period. Nevertheless, working gas levels remain 28% above the five-year average for the region. The nonsalt facilities posted a 4 Bcf injection on the week, bringing its total net build for the refill season to 122 Bcf, compared with the five-year average of 257 Bcf.
Net injections exceed range of expectations. Estimates of net injections into storage generally ranged from 31 to 47 Bcf, with a median of 42 Bcf, according to Bloomberg. As a result, the price of the Nymex contract for October delivery at the Henry Hub fell 4¢/MMBtu to $2.80/MMBtu, in 1,388 trades at the release of the Weekly Natural Gas Storage Report. Prices stabilized somewhat in subsequent trading, averaging to $2.80/MMBtu, within two minutes of the release.
Spread to the January futures price rises on the week. During the most recent storage week, the average natural gas spot price at the Henry Hub was $2.74/MMBtu, while the Nymex futures price of natural gas for delivery in January 2017 averaged $3.23/MMBtu, a difference of 49¢/MMBtu. A year ago, the premium was 37¢/MMBtu. The average Henry Hub price so far in the injection season this year, from April 1 to August 18, is $2.38/MMBtu, 14% lower than the average value of $2.76/MMBtu for the same period last year. Earlier during this year’s refill season, the premium exceeded $1/MMBtu.
Temperatures rise from week-ago levels, remain higher than normal. Temperatures in the Lower 48 states averaged 75°F, 2°F more than normal and 3°F more than last year at this time. Cooling degree-days in the Lower 48 states totaled 74, compared with 60 last year and a normal of 62. Cumulative cooling degree-days since the beginning of the refill season are 22% above normal.
See also:
| Spot Prices ($/MMBtu) | Thu, 25-Aug |
Fri, 26-Aug |
Mon, 29-Aug |
Tue, 30-Aug |
Wed, 31-Aug |
|---|---|---|---|---|---|
| Henry Hub | 2.86 |
2.87 |
2.95 |
2.92 |
2.94 |
| New York | 2.36 |
2.00 |
1.91 |
1.74 |
1.39 |
| Chicago | 2.81 |
2.81 |
2.95 |
2.96 |
2.90 |
| Cal. Comp. Avg.* | 2.92 |
2.86 |
3.04 |
3.09 |
2.99 |
| Futures ($/MMBtu) | |||||
| September Contract | 2.846 |
2.871 |
2.853 |
Expired |
Expired |
| October Contract | 2.827 |
2.887 |
2.885 |
2.913 |
2.896 |
| November Contract | 2.949 |
3.003 |
3.010 |
3.030 |
3.011 |
| *Avg. of NGI's reported prices for: Malin, PG&E Citygate, and Southern California Border Avg. | |||||
| Source: NGI's Daily Gas Price Index | |||||
| U.S. natural gas supply - Gas Week: (8/25/16 - 8/31/16) | |||
|---|---|---|---|
Average daily values (Bcf/d): |
|||
this week |
last week |
last year |
|
| Marketed production | 81.1
|
81.6
|
82.5
|
| Dry production | 72.9
|
73.4
|
74.1
|
| Net Canada imports | 6.2
|
6.3
|
5.7
|
| LNG pipeline deliveries | 0.2
|
0.2
|
0.2
|
| Total supply | 79.3
|
79.9
|
80.0
|
|
Source: OPIS PointLogic Energy, an IHS Company | |||
| U.S. natural gas consumption - Gas Week: (8/25/16 - 8/31/16) | |||
|---|---|---|---|
Average daily values (Bcf/d): |
|||
this week |
last week |
last year |
|
| U.S. consumption | 53.2
|
61.0
|
59.4
|
| Power | 30.5
|
33.9
|
31.3
|
| Industrial | 16.6
|
19.4
|
19.8
|
| Residential/commercial | 6.1
|
7.7
|
8.3
|
| Mexico exports | 3.6
|
3.7
|
3.3
|
| Pipeline fuel use/losses | 5.7
|
6.5
|
6.4
|
| LNG pipeline receipts | 0.7
|
0.7
|
0.0
|
| Total demand | 63.2
|
71.9
|
69.0
|
|
Source: OPIS PointLogic Energy, an IHS Company | |||
| Rigs | |||
|---|---|---|---|
Fri, August 26, 2016 |
Change from |
||
last week |
last year |
||
| Oil rigs | 406 |
2.5% |
-39.8% |
| Natural gas rigs | 83 |
0.0% |
-60.7% |
| Miscellaneous | 2 |
0.0% |
0.0% |
| Rig numbers by type | |||
|---|---|---|---|
Fri, August 26, 2016 |
Change from |
||
last week |
last year |
||
| Vertical | 64 |
3.2% |
-50.8% |
| Horizontal | 382 |
1.9% |
-43.6% |
| Directional | 45 |
2.3% |
-42.3% |
| Source: Baker Hughes Inc. | |||
| Working gas in underground storage | ||||
|---|---|---|---|---|
Stocks billion cubic feet (Bcf) |
||||
| Region | 2016-08-26 |
2016-08-19 |
change |
|
| East | 796 |
775 |
21 |
|
| Midwest | 904 |
875 |
29 |
|
| Mountain | 222 |
219 |
3 |
|
| Pacific | 310 |
310 |
0 |
|
| South Central | 1,169 |
1,171 |
-2 |
|
| Total | 3,401 |
3,350 |
51 |
|
| Source: U.S. Energy Information Administration | ||||
| Working gas in underground storage | |||||
|---|---|---|---|---|---|
Historical comparisons |
|||||
Year ago (8/26/15) |
5-year average (2011-2015) |
||||
| Region | Stocks (Bcf) |
% change |
Stocks (Bcf) |
% change |
|
| East | 744 |
7.0 |
751 |
6.0 |
|
| Midwest | 802 |
12.7 |
822 |
10.0 |
|
| Mountain | 187 |
18.7 |
178 |
24.7 |
|
| Pacific | 345 |
-10.1 |
330 |
-6.1 |
|
| South Central | 1,085 |
7.7 |
987 |
18.4 |
|
| Total | 3,163 |
7.5 |
3,067 |
10.9 |
|
| Source: U.S. Energy Information Administration | |||||
| Temperature -- heating & cooling degree days (week ending Aug 25) | ||||||||
|---|---|---|---|---|---|---|---|---|
HDD deviation from: |
CDD deviation from: |
|||||||
| Region | HDD Current |
normal |
last year |
CDD Current |
normal |
last year |
||
| New England | 0
|
-5
|
0
|
55
|
28
|
-1
|
||
| Middle Atlantic | 0
|
-3
|
-2
|
61
|
21
|
14
|
||
| E N Central | 2
|
-4
|
-17
|
49
|
10
|
39
|
||
| W N Central | 5
|
-3
|
-16
|
45
|
-7
|
25
|
||
| South Atlantic | 0
|
-1
|
0
|
107
|
22
|
13
|
||
| E S Central | 0
|
0
|
-2
|
93
|
12
|
28
|
||
| W S Central | 0
|
0
|
0
|
111
|
-5
|
2
|
||
| Mountain | 9
|
-2
|
5
|
66
|
0
|
-9
|
||
| Pacific | 0
|
-5
|
0
|
62
|
20
|
1
|
||
| United States | 2
|
-3
|
-5
|
74
|
12
|
14
|
||
|
Note: HDD = heating degree-day; CDD = cooling degree-day Source: National Oceanic and Atmospheric Administration | ||||||||
Average temperature (°F)
7-Day Mean ending Aug 25, 2016
Source: NOAA/National Weather Service
Deviation between average and normal (°F)
7-Day Mean ending Aug 25, 2016
Source: NOAA/National Weather Service