In the News:
Use of natural gas for power generation hits record highs
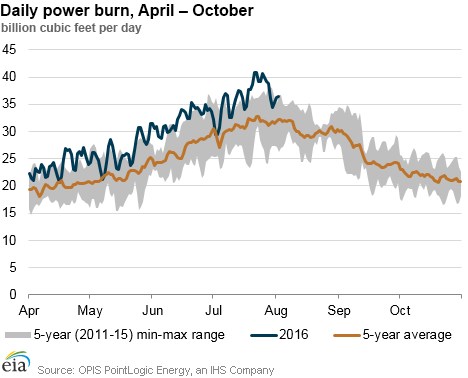
Consumption of natural gas for power generation (power burn), which has been very high throughout 2016, recently hit its highest daily level on record on July 21, reaching 40.9 billion cubic feet per day (Bcf/d). Power burn surpassed the 40 Bcf/d threshold on three separate days in late July as widespread hot weather led to strong demand for air conditioning. According to PointLogic data, nine of the ten highest power burn days on record occurred in July 2016, and one was in July 2015. Natural gas consumption for power generation in July averaged 36.1 Bcf/d, according to PointLogic data. This is 2.7 Bcf/d higher than July 2015 and 1.5 Bcf/d higher than the previous high from July 2012.
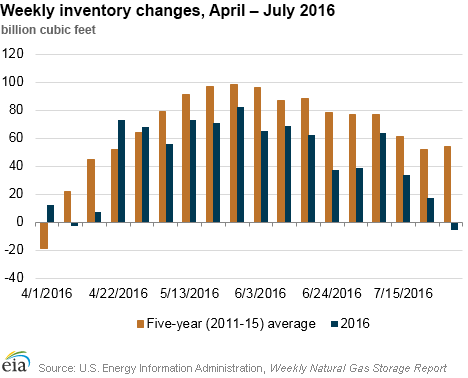
Increases in power burn, as well as record high storage levels at the start of the injection season and slowing production, have supported relatively low net injections of natural gas into underground storage facilities this summer. Net injections have fallen short of both last year's levels and the five-year (2011-15) average for most weeks this summer, according to EIA's Weekly Natural Gas Storage Report. For the week ending July 29, inventories posted an overall net withdrawal for the first time in 10 years in the summer months. While positive net withdrawals are very common in the South Central region in the summer, they are usually offset by positive net injections in the other four storage regions. During the most recent storage report week, no part of the Lower 48 states was immune to heat, as highs reached into the 90s throughout most areas of the country.
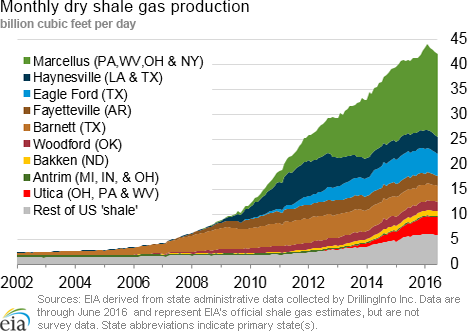
Low natural gas prices and growth in natural gas power generation infrastructure are the main driving factors behind this summer's growth in natural gas use. While the summer season is generally the time of year when power burn is highest, because of air-conditioning demand, gas consumption for power generation has also been rising in the winter, as natural gas makes up a larger share of baseload generation.
Overview:
(For the Week Ending Wednesday, August 3, 2016)
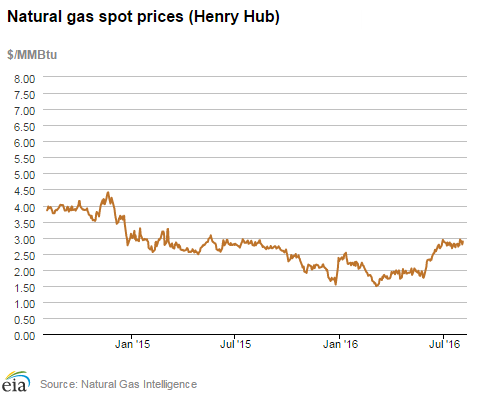
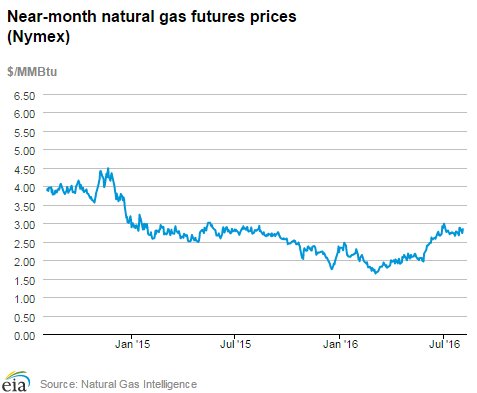
- Natural gas spot prices were mixed this report week (Wednesday, July 27, to Wednesday, August 3). The Henry Hub spot price rose from $2.80 per million British thermal units (MMBtu) last Wednesday to $2.88/MMBtu yesterday.
- At the New York Mercantile Exchange (Nymex), the August 2016 contract expired last Wednesday at $2.672/MMBtu. The September 2016 finished the report week at $2.839/MMBtu, up 17¢ Wednesday to Wednesday.
- EIA reports first summertime weekly net withdrawal since 2006. Net withdrawals from working gas totaled 6 Bcf for the week ending July 29. Working gas stocks are 3,288 Bcf, which is 13% greater than the year-ago level and 16% greater than the five-year (2011-15) average for this week.
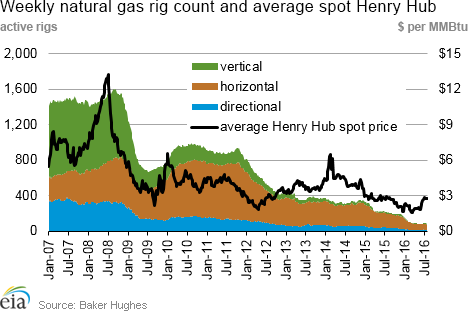
- According to Baker Hughes, for the week ending Friday, July 29, the natural gas rig count decreased by 2 to 86. The number of oil-directed rigs rose by 3 to 374. The total rig count climbed by 1, and now stands at 463.
- The natural gas plant liquids composite price at Mont Belvieu, Texas, fell by 17¢, closing at $4.69/MMBtu for the week ending July 29. Prices of natural gasoline and isobutane each fell 4%. Prices for propane and butane fell by 7% and 5%, respectively, while the price of ethane rose by 3%.
Prices/Supply/Demand:
Spot price movements are mixed. This report week, the Henry Hub spot price rose 8¢ from $2.80/MMBtu last Wednesday to $2.88/MMBtu yesterday. Similarly, at the Chicago Citygate, prices increased 10¢ from $2.75/MMBtu last Wednesday to $2.85/MMBtu yesterday. In California, prices were mixed. At the Northern California PG&E Citygate, prices gained 3¢, going from $3.15/MMBtu last Wednesday to $3.18/MMBtu yesterday. By contrast, in Southern California, prices fell 63¢ over the report week to $2.79/MMBtu as hot weather moderated.
Northeast market prices fall. In the Northeast, temperatures backed off from the extremely hot weather that occurred last week. At the Algonquin Citygate, which serves Boston-area consumers, prices went down 2¢ from $2.95/MMBtu last Wednesday to $2.93/MMBtu yesterday. The price decline in New York was more significant. At the Transcontinental Pipeline's Zone 6 New York trading point, prices decreased 66¢ from $2.39/MMBtu last Wednesday to $1.73/MMBtu yesterday.
Marcellus prices mixed. While Tennessee Zone 4 Marcellus spot prices advanced 9¢ from $1.25/MMBtu last Wednesday to $1.34/MMBtu yesterday, prices at Dominion South in northwest Pennsylvania fell 2¢ from $1.36/MMBtu last Wednesday to $1.34/MMBtu yesterday.
August contract expires. At the Nymex, the August 2016 contract expired last Wednesday (July 27) at $2.672/MMBtu. The September 2016 contract increased to $2.839/MMBtu, up 17¢ Wednesday to Wednesday. The price of the 12-month strip, averaging September 2016 through August 2017 futures contracts, increased 10.4¢ from $3.024/MMBtu to $3.128/MMBtu.
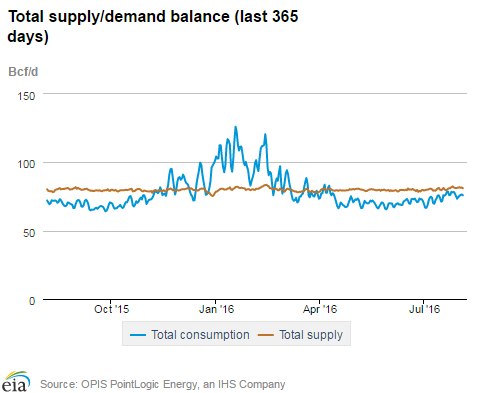
Supply flat. According to data from PointLogic, total supply of natural gas remained the same as last week, averaging 81.4 Bcf/d. Dry production grew by 1% over the report week, and was equal to its year-ago level. Average net imports from Canada decreased by 9% from last week, and liquefied natural gas (LNG) sendout remained flat.
Consumption falls. During the report week, total U.S. consumption of natural gas fell by 3%, according to data from PointLogic. Power burn declined by 8% week over week; in the previous week, hot weather drove power burn to hit record highs. Industrial sector consumption stayed constant, averaging 19.5 Bcf/d. In the residential and commercial sectors, consumption remained at last week's level, averaging 19.5 Bcf/d. Natural gas exports to Mexico declined 1%.
U.S. LNG exports. The natural gas pipeline flows to the Sabine Pass liquefaction terminal averaged 0.9 Bcf/d for the week ending Wednesday, August 3, 26% higher than the previous week. Pipeline receipts at the terminal reached 1.1 Bcf/d last Friday, as part of testing of the terminal's second train, but declined to 0.5 Bcf/d on Monday, and remained at 0.8 Bcf/d yesterday, according to PointLogic data. Increased pipeline flow to the terminal is part of a standard testing of a liquefaction train prior to start-up, and involves ramping operation of the train up and down, according to Genscape. Train 2 of the Sabine Pass terminal is scheduled to come online in September. One vessel (LNG-carrying capacity 3.5 Bcf) left the terminal last Thursday and is currently transiting the Panama Canal. This is the third LNG vessel to transit the expanded Panama Canal since July, and the second vessel carrying LNG from Sabine Pass through the Canal. One vessel (LNG-carrying capacity 3.0 Bcf) is currently loading at the terminal.
Storage:
U.S. posts first summertime weekly net withdrawal since 2006. Net withdrawals from storage totaled 6 Bcf, compared with the five-year (2011-15) average net injection of 54 Bcf and last year's net injections of 41 Bcf during the same week. This is only the third time ever that net withdrawals from working gas stocks were reported on a national basis during the summer months. The two other summertime withdrawals both occurred in 2006 (July 21 and August 4), which predates the new five-region format of EIA's WNGSR that was introduced in 2015. Working gas stocks total 3,288 Bcf, 464 Bcf above the five-year average and 389 Bcf above last year at this time. The net withdrawal on the national level resulted from two key factors: relatively small injections in the East and Midwest regions and large withdrawals from storage in the South Central region. The Pacific region also reported a net withdrawal of 4 Bcf for the week.
South Central region posts largest summertime weekly net withdrawal on record. Withdrawals from storage in the South Central region totaled 26 Bcf, owing to strong cooling demand for natural gas in the region. This is the largest withdrawal reported in the history of the five-region storage estimates, which have data back to January 2010. At 26 Bcf, net withdrawals this week in the South Central region also topped the summertime record for the predecessor region in the old three-region format (the Producing region).
The East and Midwest regions posted the smallest summertime net injections since 2012. Net injections in the Midwest and East regions totaled 24 Bcf. In 2012, total injections in the regions totaled less than 24 Bcf three times during the summer months, reporting withdrawals of 20, 23, and 20 Bcf in successive weeks during the three-week period from July 6-20 in that year. The Midwest region reported net injections of 10 Bcf–the lowest ever reported since 2010.
Stock change is at the lower end of analyst expectations. Despite the highly unusual summertime withdrawal from storage, the weekly stock change fell within the range of expectations as some analysts called for the withdrawal. The expected stock change for the week generally ranged from withdrawals of 6 Bcf to net injections of 10 Bcf. Bloomberg reported a median net increase of 3 Bcf. Net withdrawals for the week totaled 4 Bcf according to pipeline scrape data collected by PointLogic Energy. Prices for the Nymex futures contract for September delivery at the Henry Hub rose about 4¢/MMBtu to $2.88/MMBtu, with 1,026 contracts traded at the release of EIA's WNGSR. Prices drifted back down in subsequent trading, reaching the pre-release price of $2.84/MMBtu within two minutes of the release.
Spread to the January futures price continues to narrow. During the most recent storage week, the average natural gas spot price at the Henry Hub was $2.77/MMBtu, while the Nymex futures price of natural gas for delivery in January 2017 averaged $3.23/MMBtu, a difference of 46¢/MMBtu. Last week, the premium averaged 56¢/MMBtu. A year ago, the premium was 27¢/MMBtu. The average Henry Hub price so far in the injection season this year, from April 1 to July 29, is $2.27/MMBtu, 17% lower than the average value of $2.75/MMBtu for the same period last year. Earlier during this year's refill season, the premium exceeded $1/MMBtu.
Temperatures reach highest levels in 2016, increasing cooling demand for natural gas. Temperatures in the Lower 48 states averaged 80°F, 5°F above the normal and 3°F above last year at this time. Cumulative cooling degree-days in the Lower 48 states totaled 761 since April 1, compared to the normal of 615. Every U.S. Census region featured above-normal temperatures for the report week.
See also:
| Spot Prices ($/MMBtu) | Thu, 28-Jul |
Fri, 29-Jul |
Mon, 01-Aug |
Tue, 02-Aug |
Wed, 03-Aug |
|---|---|---|---|---|---|
| Henry Hub |
2.76 |
2.94 |
2.87 |
2.79 |
2.88 |
| New York |
1.66 |
2.04 |
2.03 |
1.96 |
1.73 |
| Chicago |
2.69 |
2.87 |
2.81 |
2.76 |
2.85 |
| Cal. Comp. Avg.* |
2.97 |
2.99 |
2.95 |
2.88 |
2.87 |
| Futures ($/MMBtu) | |||||
| September contract |
2.873 |
2.876 |
2.771 |
2.733 |
2.839 |
| October contract |
2.909 |
2.917 |
2.818 |
2.783 |
2.881 |
| *Avg. of NGI's reported prices for: Malin, PG&E Citygate, and Southern California Border Avg. | |||||
| Source: NGI's Daily Gas Price Index | |||||

| U.S. natural gas supply - Gas Week: (7/28/16 - 8/3/16) | |||
|---|---|---|---|
Average daily values (Bcf/d): |
|||
this week |
last week |
last year |
|
| Marketed production | 81.6
|
80.5
|
81.3
|
| Dry production | 74.0
|
73.0
|
73.4
|
| Net Canada imports | 7.2
|
7.9
|
6.4
|
| LNG pipeline deliveries | 0.2
|
0.2
|
0.2
|
| Total supply | 81.4
|
81.2
|
80.0
|
|
Source: OPIS PointLogic Energy, an IHS Company | |||
| U.S. natural gas consumption - Gas week: Gas Week: (7/28/16 - 8/3/16) | |||
|---|---|---|---|
Average daily values (Bcf/d): |
|||
this week |
last week |
last year |
|
| U.S. consumption | 63.9
|
66.0
|
63.0
|
| Power | 36.7
|
40.0
|
36.1
|
| Industrial | 19.5
|
19.5
|
19.4
|
| Residential/commercial | 7.7
|
6.6
|
7.5
|
| Mexico exports | 3.8
|
3.8
|
3.3
|
| Pipeline fuel use/losses | 6.9
|
7.1
|
6.8
|
| LNG pipeline receipts | 0.9
|
0.7
|
0.0
|
| Total demand | 75.5
|
77.7
|
73.1
|
|
Source: OPIS PointLogic Energy, an IHS Company | |||
| Rigs | |||
|---|---|---|---|
Fri, July 29, 2016 |
Change from |
||
last week |
last year |
||
| Oil rigs | 374 |
0.8% |
-43.7% |
| Natural gas rigs | 86 |
-2.3% |
-58.9% |
| Miscellaneous | 3 |
0.0% |
200.0% |
| Rig numbers by type | |||
|---|---|---|---|
Fri, July 29, 2016 |
Change from |
||
last week |
last year |
||
| Vertical | 61 |
0.0% |
-51.6% |
| Horizontal | 354 |
-0.8% |
-46.7% |
| Directional | 48 |
9.1% |
-42.9% |
| Source: Baker Hughes Inc. | |||
| Working gas in underground storage | ||||
|---|---|---|---|---|
Stocks billion cubic feet (Bcf) |
||||
| Region | 2016-07-29 |
2016-07-22 |
change |
|
| East | 729 |
715 |
14 |
|
| Midwest | 825 |
815 |
10 |
|
| Mountain | 213 |
213 |
0 |
|
| Pacific | 314 |
318 |
-4 |
|
| South Central | 1,207 |
1,233 |
-26 |
|
| Total | 3,288 |
3,294 |
-6 |
|
| Source: U.S. Energy Information Administration | ||||
| Working gas in underground storage | |||||
|---|---|---|---|---|---|
Historical comparisons |
|||||
Year ago (7/29/15) |
5-year average (2011-2015) |
||||
| Region | Stocks (Bcf) |
% change |
Stocks (Bcf) |
% change |
|
| East | 654 |
11.5 |
668 |
9.1 |
|
| Midwest | 676 |
22.0 |
703 |
17.4 |
|
| Mountain | 173 |
23.1 |
163 |
30.7 |
|
| Pacific | 341 |
-7.9 |
322 |
-2.5 |
|
| South Central | 1,055 |
14.4 |
968 |
24.7 |
|
| Total | 2,899 |
13.4 |
2,824 |
16.4 |
|
| Source: U.S. Energy Information Administration | |||||
| Temperature -- heating & cooling degree days (week ending Jul 28) | ||||||||
|---|---|---|---|---|---|---|---|---|
HDD deviation from: |
CDD deviation from: |
|||||||
| Region | HDD Current |
normal |
last year |
CDD Current |
normal |
last year |
||
| New England | 0
|
-2
|
-2
|
84
|
39
|
41
|
||
| Middle Atlantic | 0
|
-2
|
-1
|
98
|
39
|
30
|
||
| E N Central | 0
|
-3
|
0
|
91
|
33
|
19
|
||
| W N Central | 0
|
-3
|
0
|
88
|
16
|
2
|
||
| South Atlantic | 0
|
0
|
0
|
125
|
27
|
21
|
||
| E S Central | 0
|
0
|
0
|
118
|
23
|
6
|
||
| W S Central | 0
|
0
|
0
|
139
|
13
|
-6
|
||
| Mountain | 0
|
-3
|
-2
|
107
|
27
|
31
|
||
| Pacific | 0
|
-2
|
-1
|
82
|
35
|
32
|
||
| United States | 0
|
-2
|
0
|
105
|
30
|
20
|
||
|
Note: HDD = heating degree-day; CDD = cooling degree-day Source: National Oceanic and Atmospheric Administration | ||||||||
Average temperature (°F)
7-Day Mean ending Jul 28, 2016
Source: NOAA/National Weather Service
Deviation between average and normal (°F)
7-Day Mean ending Jul 28, 2016
Source: NOAA/National Weather Service