In the News:
First LNG tanker through expanded Panama Canal is traveling from Sabine Pass
On July 25, the liquefied natural gas (LNG) vessel Maran Gas Apollonia became the first-ever LNG vessel to transit the recently expanded Panama Canal. The vessel is carrying LNG sourced from the U.S.-based Sabine Pass liquefaction terminal located in Louisiana. The expanded Panama Canal can now accommodate 90% of the world LNG tanker fleet. Transit through the Panama Canal reduces travel time and transportation costs for LNG vessels traveling from the Atlantic Basin liquefaction terminals, located primarily on the U.S. Gulf Coast, to key markets in Asia and the west coast of South America.
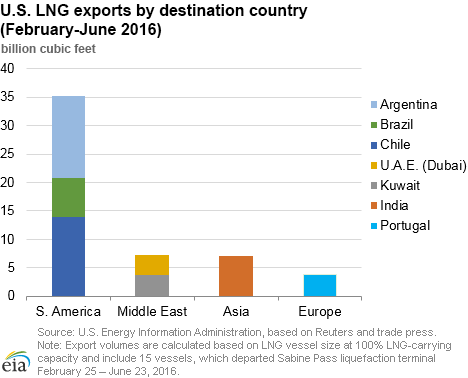
U.S. LNG exports began five months ago with the shipment of the first cargo from Train 1 of the Sabine Pass terminal on February 25. Between February and the end of June, 15 cargoes were shipped from Sabine Pass, totaling 53 billion cubic feet (Bcf) of exports, according to Reuters shipping data. Most of these exports went to South America (35 Bcf), followed by the Middle East and Asia (7 Bcf each), and Europe (4 Bcf). Four additional cargoes were exported earlier this month, totaling 13 Bcf, and another vessel is scheduled to dock at the Sabine Pass terminal today (July 28). The exports from Sabine Pass Train 1 averaged three cargoes per month in March-May, and are projected to average five cargoes per month going forward (assuming full train utilization). Train 2 of the Sabine Pass terminal is expected to begin operations in September, with the remaining three trains coming online in 2017-19.
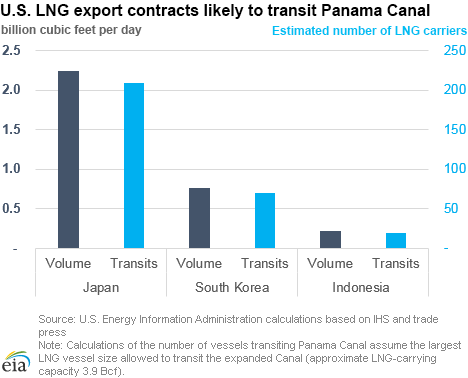
Currently in the United States, 0.6 Bcf/d of liquefaction capacity is in operation, and another 8.6 Bcf/d is under construction, with expected online dates in 2016-19. Most of U.S. liquefaction capacity is contracted under long-term (20-year) contracts, with a total of 3.2 Bcf/d contracted to Japan, South Korea, and Indonesia. Contracted volumes to these countries will likely transit the Panama Canal as it will allow reduction in travel time and transportation costs. EIA estimates that LNG traffic through the Panama Canal to transport U.S.-contracted volumes to Japan, South Korea, and Indonesia could reach 300 LNG vessels annually.
Overview:
(For the Week Ending Wednesday, July 27, 2016)
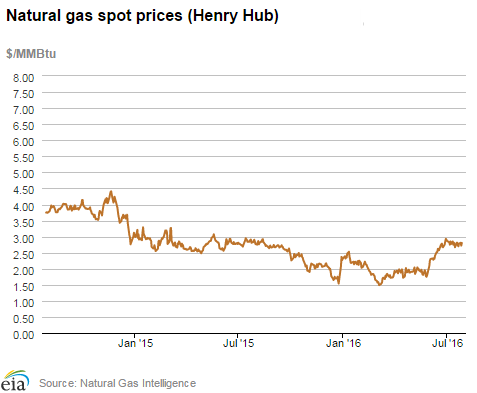
- Spot prices at most market locations rose this report week (Wednesday, July 20, to Wednesday, July 27). The Henry Hub spot price rose 8¢ from $2.72 per million British thermal units (MMBtu) last Wednesday to $2.80/MMBtu yesterday.
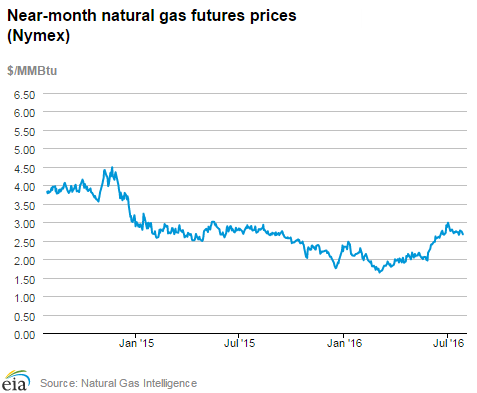
- At the New York Mercantile Exchange (Nymex), the August 2016 contract expired yesterday at $2.672/MMBtu, up 1¢ from last Wednesday. The September 2016 contract rose to $2.660/MMBtu, up 4¢ Wednesday to Wednesday.
- Net injections to working gas totaled 17 Bcf for the week ending July 22. Working gas stocks are 3,294 Bcf, which is 15% greater than the year-ago level and 19% greater than the five-year (2011-15) average for this week.
- According to Baker Hughes, for the week ending Friday, July 22, the natural gas rig count fell by 1 to 88. Oil-directed rigs increased by 14 to 371. The number of miscellaneous rigs increased by 2 during the week. The total rig count increased by 15, and now stands at 462.
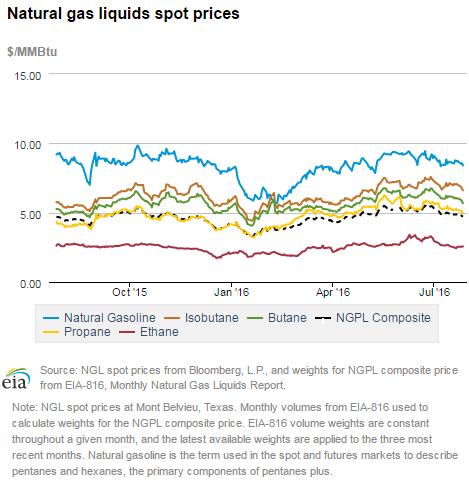
- The natural gas plant liquids composite price at Mont Belvieu, Texas, fell by 10¢, closing at $4.87/MMBtu for the week ending July 22. The price of ethane, propane, and butane fell 6%, 2%, and 1%, respectively. The price of isobutane was flat, and the price of natural gasoline rose 1%.
Prices/Supply/Demand:
Heat drives price increases. As temperatures rose this report week, the Henry Hub spot price increased 8¢ from $2.72/MMBtu last Wednesday to $2.80/MMBtu yesterday. At the Chicago Citygate, prices gained 3¢ from $2.72/MMBtu last Wednesday to $2.75/MMBtu yesterday.
California prices rise on extreme heat this week. Like most areas of the country, California experienced hot weather this week. Maximum temperatures reached into the upper 90s this week, and the California Independent System Operator (CAISO) urged consumers to conserve electricity in anticipation of high power demand. At the SoCal Citygate, prices gained 40¢ this week, from $3.02/MMBtu last Wednesday to $3.42/MMBtu yesterday. Prices at the PG&E Citygate, which serves areas farther north, where temperatures were more moderate, rose 15¢ from $3.00/MMBtu last Wednesday to $3.15/MMBtu yesterday.
Northeast prices increase. Temperatures in Boston reached into the 90s this week. At the Algonquin Citygate, which serves Boston-area consumers, prices rose 21¢ from $2.74/MMBtu last Wednesday to $2.95/MMBtu yesterday. Similarly, at the Transcontinental Pipeline's Zone 6 trading point for New York, prices rose 18¢ from $2.21/MMBtu last Wednesday to $2.39/MMBtu yesterday.
Marcellus prices decline slightly. The Tennessee Zone 4 Marcellus price fell 9¢ from $1.34/MMBtu last Wednesday to $1.25/MMBtu yesterday. The price at Dominion South in northwest Pennsylvania fell 4¢ from $1.40/MMBtu last Wednesday to $1.36/MMBtu yesterday. Last week, more than 1 billion cubic feet per day (Bcf/d) of production was curtailed because of pipeline maintenance. Price declines this week may have been the result of production coming back online when maintenance was completed over the weekend.
Nymex prices rise slightly. At the Nymex, the August 2016 contract expired yesterday at $2.672/MMBtu, up 1¢ from last Wednesday. The September 2016 contract increased to $2.660/MMBtu, up 4¢ Wednesday to Wednesday. The price of the 12-month strip averaging September 2016 through August 2017 futures contracts rose 4¢, to $3.024/MMBtu.
Supply rises. According to data from PointLogic, total supply of natural gas rose by 1% over the report week. Dry production remained flat week over week. Average net imports from Canada rose by 11% from last week. Natural gas pipeline deliveries onto the grid from LNG import terminals, a small contributor to overall supply, remained the same as last week.
Heat drives high consumption. During the report week, total U.S. consumption of natural gas rose by 5% according to data from PointLogic. Natural gas consumed by electric generators increased 9% week over week and hit a record high at 40.7 Bcf on Monday. Electric power consumption was particularly high in the southeastern states this week. Industrial sector consumption remained the same as last week, averaging 19.5 Bcf/d. In the residential and commercial sectors, consumption fell by 7%. Natural gas exports to Mexico rose by 2%.
U.S. LNG exports. The natural gas pipeline flows to Sabine Pass liquefaction terminal averaged 0.7 Bcf/d, 7% higher than last week. One vessel (LNG-carrying capacity 3.6 Bcf) departed the terminal last week, and one vessel (LNG-carrying capacity 3.5 Bcf) is currently loading at the terminal.
Storage:
U.S. posts smallest summertime weekly net injection since 2012. Net injections into storage totaled 17 Bcf, compared with the five-year (2011-15) average net injection of 52 Bcf and last year's net injections of 52 Bcf during the same week. This is the smallest summertime (June–August) weekly net injection since August 2012. Working gas stocks total 3,294 Bcf, 524 Bcf above the five-year average and 436 Bcf above last year at this time.
South Central region posts second consecutive weekly net withdrawal. Weekly net withdrawals have occurred in the South Central region during four out of the last five weeks. Nevertheless, withdrawals from storage in the South Central region during the summer months are fairly common. Working gas stocks in the region remain 17% above last year's level and 28% above the five-year average. Working gas stocks held steady during the week in the Pacific, 4 Bcf below the five-year average net injection for the report week. This marks the 12th week in a row that net injections fell below the five-year average in the Pacific region.
Stock change is significantly below analyst expectations. Expected net injections for the week ranged from 22 to 33 Bcf, with a median of 26 Bcf, as reported by Bloomberg. This week's Weekly Natural Gas Storage Report (WNGSR) figure was below the low end of expectations for the second week in a row. Prices for the Nymex futures contract for September delivery at the Henry Hub rose about 4¢/MMBtu to $2.77/MMBtu, with 2,987 contracts traded at the release of the WNGSR. Prices continued to rise, reaching $2.80/MMBtu within two minutes of the release.
Spread to the January futures price remains stable. During the most recent storage week, the average natural gas spot price at the Henry Hub was $2.74/MMBtu, while the Nymex futures price of natural gas for delivery in January 2017 averaged $3.30/MMBtu, a difference of 56¢/MMBtu. A year ago, the premium was 40¢/MMBtu. The average Henry Hub price so far in the injection season this year, from April 1 to July 22, is $2.25/MMBtu, 18% lower than the average value of $2.74/MMBtu for the same period last year. Earlier during this year's refill season, the premium exceeded $1/MMBtu.
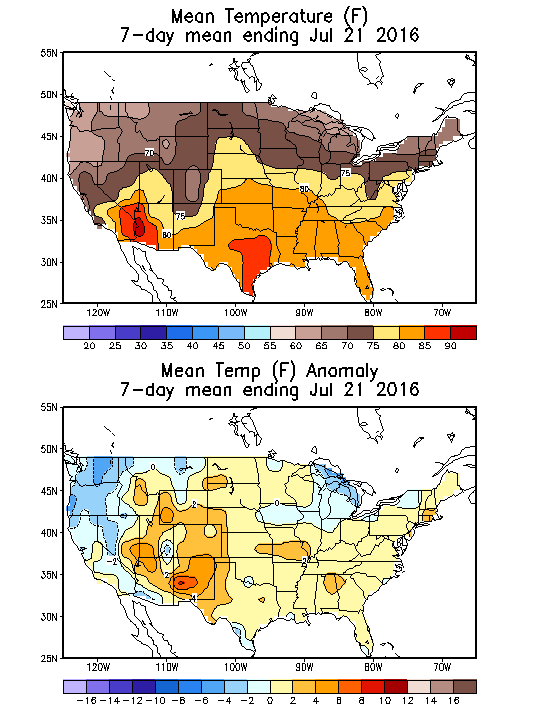
Ongoing hot weather elevates cooling demand for natural gas. Temperatures in the Lower 48 states averaged 77°F, 2°F above the normal and 1°F above last year at this time. Cumulative cooling degree-days in the Lower 48 states totaled 656 since April 1, compared to the normal of 556. Every U.S. Census region featured above-normal temperatures for the report week.
See also:
| Spot Prices ($/MMBtu) | Thu, 21-Jul |
Fri, 22-Jul |
Mon, 25-Jul |
Tue, 26-Jul |
Wed, 27-Jul |
|---|---|---|---|---|---|
| Henry Hub |
2.70 |
2.78 |
2.81 |
2.72 |
2.80 |
| New York |
2.77 |
2.89 |
2.79 |
2.62 |
2.39 |
| Chicago |
2.74 |
2.84 |
2.75 |
2.70 |
2.75 |
| Cal. Comp. Avg.* |
2.86 |
3.09 |
2.94 |
2.90 |
3.05 |
| Futures ($/MMBtu) | |||||
| August contract | 2.692
|
2.777
|
2.747
|
2.712
|
2.672
|
| September contract |
2.659 |
2.743 |
2.712 |
2.677 |
2.660 |
| *Avg. of NGI's reported prices for: Malin, PG&E Citygate, and Southern California Border Avg. | |||||
| Source: NGI's Daily Gas Price Index | |||||
| U.S. natural gas supply - Gas Week: (7/21/16 - 7/27/16) | |||
|---|---|---|---|
Average daily values (Bcf/d): |
|||
this week |
last week |
last year |
|
| Marketed production | 80.5
|
80.4
|
81.1
|
| Dry production | 73.0
|
72.9
|
73.2
|
| Net Canada imports | 7.9
|
7.1
|
5.9
|
| LNG pipeline deliveries | 0.2
|
0.2
|
0.2
|
| Total supply | 81.2
|
80.2
|
79.2
|
|
Source: OPIS PointLogic Energy, an IHS Company | |||
| U.S. natural gas consumption - Gas week: Gas Week: (7/21/16 - 7/27/16) | |||
|---|---|---|---|
Average daily values (Bcf/d): |
|||
this week |
last week |
last year |
|
| U.S. consumption | 66.0
|
63.2
|
61.5
|
| Power | 40.0
|
36.6
|
34.4
|
| Industrial | 19.5
|
19.5
|
19.4
|
| Residential/commercial | 6.6
|
7.1
|
7.6
|
| Mexico exports | 3.8
|
3.8
|
3.3
|
| Pipeline fuel use/losses | 7.1
|
6.8
|
6.6
|
| LNG pipeline receipts | 0.7
|
0.7
|
0.0
|
| Total demand | 77.7
|
74.4
|
71.4
|
|
Source: OPIS PointLogic Energy, an IHS Company | |||

| Rigs | |||
|---|---|---|---|
Fri, July 22, 2016 |
Change from |
||
last week |
last year |
||
| Oil rigs | 371 |
3.9% |
-43.7% |
| Natural gas rigs | 88 |
-1.1% |
-59.3% |
| Miscellaneous | 3 |
200.0% |
200.0% |
| Rig numbers by type | |||
|---|---|---|---|
Fri, July 22, 2016 |
Change from |
||
last week |
last year |
||
| Vertical | 61 |
1.7% |
-53.4% |
| Horizontal | 357 |
3.8% |
-46.1% |
| Directional | 44 |
2.3% |
-47.0% |
| Source: Baker Hughes Inc. | |||
| Working gas in underground storage | ||||
|---|---|---|---|---|
Stocks billion cubic feet (Bcf) |
||||
| Region | 2016-07-22 |
2016-07-15 |
change |
|
| East | 715 |
697 |
18 |
|
| Midwest | 815 |
801 |
14 |
|
| Mountain | 213 |
210 |
3 |
|
| Pacific | 318 |
318 |
0 |
|
| South Central | 1,233 |
1,251 |
-18 |
|
| Total | 3,294 |
3,277 |
17 |
|
| Source: U.S. Energy Information Administration | ||||
| Working gas in underground storage | |||||
|---|---|---|---|---|---|
Historical comparisons |
|||||
Year ago (7/22/15) |
5-year average (2011-2015) |
||||
| Region | Stocks (Bcf) |
% change |
Stocks (Bcf) |
% change |
|
| East | 638 |
12.1 |
650 |
10.0 |
|
| Midwest | 652 |
25.0 |
678 |
20.2 |
|
| Mountain | 170 |
25.3 |
162 |
31.5 |
|
| Pacific | 339 |
-6.2 |
316 |
0.6 |
|
| South Central | 1,058 |
16.5 |
965 |
27.8 |
-6.3 |
211 |
20.9 |
| South Central | 619 |
64.8 |
701 |
45.5 |
|
| Total | 2,858 |
15.3 |
2,770 |
18.9 |
|
| Source: U.S. Energy Information Administration | |||||
| Temperature -- heating & cooling degree days (week ending Jul 21) | ||||||||
|---|---|---|---|---|---|---|---|---|
HDD deviation from: |
CDD deviation from: |
|||||||
| Region | HDD Current |
normal |
last year |
CDD Current |
normal |
last year |
||
| New England | 1
|
-1
|
0
|
67
|
24
|
14
|
||
| Middle Atlantic | 0
|
-1
|
-1
|
76
|
18
|
6
|
||
| E N Central | 1
|
-1
|
0
|
61
|
4
|
5
|
||
| W N Central | 1
|
-2
|
0
|
81
|
9
|
7
|
||
| South Atlantic | 0
|
0
|
0
|
112
|
15
|
0
|
||
| E S Central | 0
|
0
|
0
|
111
|
16
|
-4
|
||
| W S Central | 0
|
0
|
0
|
138
|
13
|
0
|
||
| Mountain | 0
|
-4
|
0
|
97
|
18
|
29
|
||
| Pacific | 1
|
-2
|
1
|
53
|
9
|
0
|
||
| United States | 1
|
-1
|
0
|
87
|
13
|
5
|
||
|
Note: HDD = heating degree-day; CDD = cooling degree-day Source: National Oceanic and Atmospheric Administration | ||||||||
Average temperature (°F)
7-Day Mean ending Jul 21, 2016
Source: NOAA/National Weather Service
Deviation between average and normal (°F)
7-Day Mean ending Jul 21, 2016
Source: NOAA/National Weather Service