In the News:
Asian LNG imports decline in 2015 amid reduced demand for electricity and lower prices of competing fuels
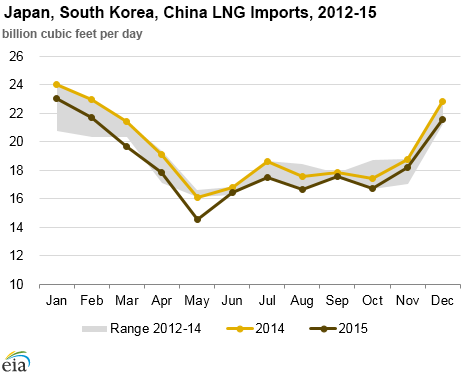
Total imports of liquefied natural gas (LNG) by Japan, South Korea, and China, the three largest global LNG importers, all located in North Asia, declined by an average of 1.0 billion cubic feet per day (Bcf/d) (5%) in 2015, as compared to 2014, and averaged 18.5 Bcf/d. This was the first annual decline in the combined LNG imports in these countries since the global economic crisis of 2009. Reduced demand for natural gas by the power generation sector, driven by slower economic growth and lower-priced competing fuels, resulted in reduced LNG consumption. In Japan and South Korea, nearly all of the gas consumed is supplied via LNG imports, whereas China receives a significant percentage of natural gas from domestic production and pipeline imports.
South Korea accounted for the largest annual decline (0.5 Bcf/d, or 10%), as greater use of coal-fired and nuclear power plants displaced gas-fired generation. This was the second consecutive year of decline in LNG consumption, with LNG imports averaging 4.5 Bcf/d, almost the same level as in 2010.
LNG imports in Japan averaged 11.4 Bcf/d in 2015, 0.5 Bcf/d (4%) lower than in 2014, primarily because of lower demand for gas-fired generation in the power sector. LNG consumption in power generation declined by 6% in 2015 year-on-year, while consumption of crude oil and heavy fuel oil also declined, by 27% and 23%, respectively, according to data from the Federation of Electric Power Companies of Japan, despite a significant decrease in crude oil prices over this period. The power generation sector experienced the fifth consecutive year of declines, with total generation being 12% lower in 2015 than in 2010, because higher electricity prices and lower electricity demand from lackluster economic activity drove down electricity consumption. Higher-cost thermal generation was substituted for nuclear generation that was shut down after the March 2011 tsunami, driving up the price of electricity. Nuclear generation is gradually returning to service (as of December 2015, it accounted for 2% of the total electricity generation) and is expected to further reduce demand for generation from fossil fuels in the coming years.
In China, annual LNG imports declined by 1% in 2015, the first annual decline since LNG imports began in 2006. The overall natural gas supply in China grew by 0.5 Bcf/d (3%) in 2015 to 17.9 Bcf/d as compared with the previous year, with domestic production accounting for 67%, pipeline imports for 18% and LNG imports for 15% of the total. While domestic production grew by 0.3 Bcf/d (2%) year-on-year, its annual growth rate in 2015 was considerably lower than the cumulative aggregate growth rate of 11% in 2011-14. The decline in LNG imports was driven by a slowdown in the growth of the Chinese economy, lower prices of competing fuels, and higher pipeline imports, which increased by 0.2 Bcf/d (7%). An increase in pipeline imports was driven by lower pipeline import prices, which averaged $7.50 per million British thermal units (MMBtu), about $1/MMBtu lower than LNG import prices, which averaged $8.70/MMBtu in 2015, according to statistical data by China's Customs.
Overview:
(For the Week Ending Wednesday, February 17, 2016)
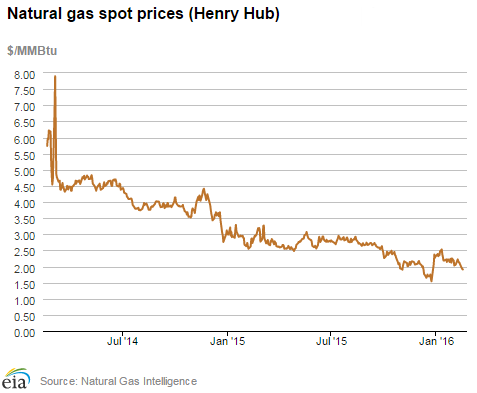
- Natural gas prices fell substantially at most market locations this report week (Wednesday, February 10, to Wednesday, February 17), with the biggest declines in the Northeast. The Henry Hub spot price fell from $2.13 per MMBtu last Wednesday to $1.91/MMBtu yesterday.
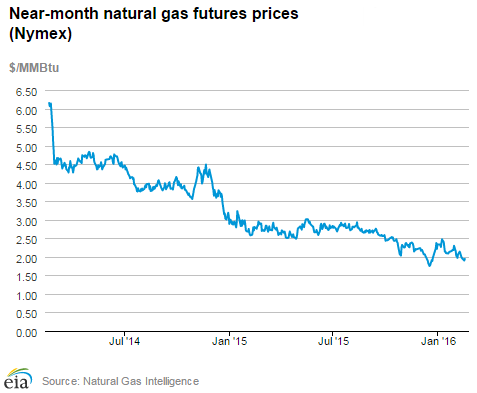
- At the New York Mercantile Exchange (Nymex), the price of the near-month (March 2016) contract fell a dime from $2.046/MMBtu last Wednesday to $1.942/MMBtu yesterday.
- Net withdrawals from storage totaled 158 billion cubic feet (Bcf), reducing working gas stocks to 2,706 Bcf for the report week ending February 12. Working gas stocks are 24% and 26% above the year-ago and five-year (2011-15) levels, respectively.
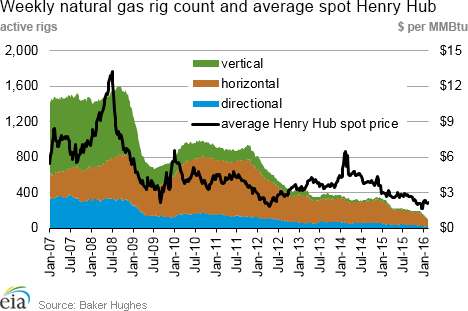
- The total oil and natural gas rig count declined by 30 units, with 541 units in service for the week ending Friday, February 12, according to data from Baker Hughes Incorporated. The oil rig count decreased by 28 units to 439, and the natural gas rig count fell by 2 units to 102. This is the sixth consecutive double-digit weekly decline and the lowest recorded natural gas rig count in the Baker Hughes dataset, which goes back to 1987.
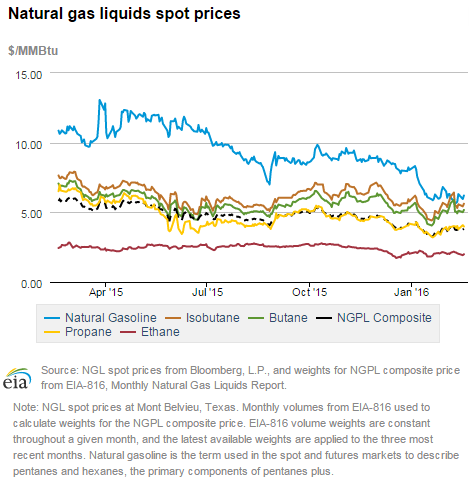
- The natural gas plant liquids (NGPL) composite price at Mont Belvieu, Texas, fell by 0.4% to $3.80/MMBtu for the week ending Friday, February 12. The spot prices of liquid products were mixed this week; butane, isobutane, and natural gasoline were down 0.8%, 1.1%, and 6.8%, respectively, and propane and ethane were up 2.1% and 2.8%, respectively.
Prices/Demand/Supply:
Natural gas prices decline. Prices posted a Wednesday-to-Wednesday decline across the country as temperatures warmed near the end of the report week. The Henry Hub spot price fell from $2.13/MMBtu last Wednesday to $1.91/MMBtu yesterday, February 17, and fell each day of the report week. At the Chicago Citygate, the spot price fell from $2.17/MMBtu last Wednesday to $1.91/MMBtu yesterday. At the Opal Hub in Wyoming, prices opened the report week at $1.88/MMBtu and ended yesterday at $1.63. At SoCal Citygate, the price fell from $2.17/MMBtu to $1.91 yesterday.
Northeast prices rise, then decline dramatically. Heading into a frigid weekend, prices rose at major Northeastern market locations, with the largest increase in pricing locations serving New York. At Transcontinental Pipeline's Zone 6 trading point serving New York City, prices began the week at $5.99/MMBtu, rose to $8.14/MMBtu heading into the cold weekend, then ended the week at $2.12/MMBtu. At Transco's Zone 6 non-New York trading point, which serves Pennsylvania and New Jersey consumers, prices rose Friday to $6.10/MMBtu before settling yesterday at $2.03/MMBtu. At the Algonquin Citygate, which serves Boston, prices began the week at $6.50/MMBtu, peaked at $6.76/MMBtu, then settled yesterday at $4.18/MMBtu.
Marcellus prices mixed. At Dominion South in northwest Pennsylvania, prices began at $1.53/MMBtu last Wednesday and ended the report week at $1.36/MMBtu yesterday. On Transco's Leidy Line in northern Pennsylvania, prices remained flat, beginning and ending the report week at $1.32/MMBtu.
Nymex prices fall. The price of the Nymex March 2016 contract fell this week from $2.046/MMBtu last Wednesday to $1.942/MMBtu yesterday. The price of the 12-month strip (the 12 contracts between March 2016 and February 2017) fell from $2.376/MMBtu last Wednesday to $2.299 yesterday.
Production rises. Despite the historically low rig count and declines in prices, dry natural gas production rose 0.4% week-over-week and is 1.5% higher than the same week last year, according to Bentek data. Bentek data also indicate that dry production hit a daily record on February 16 at 73.5 Bcf/d. U.S. imports of natural gas from Canada rose by 14.2%, driven by a large increase in imports into the Northeast. Pipeline imports to the West increased 2.0% and imports to the Midwest declined by 0.1%. LNG sendout also increased, but is a small contributor to overall supply.
Consumption increases with weekend cold snap. U.S. consumption increased by 5.8% for the report period, driven by a large increase in residential/commercial consumption related to the cold weather. According to Bentek data, residential/commercial consumption, which is largely used for heating, increased by 16.3% week over week. Industrial consumption rose 1.1%, and consumption of natural gas for electric power generation fell 8.0%. U.S. exports of natural gas to Mexico rose 3.5%, and were 59.2% greater than the same week a year ago.
Storage
Net withdrawals are above the five-year average but below last year's withdrawals. The net withdrawal from storage for the week ending Friday, February 12, was 158 Bcf, compared with the five-year average net withdrawal of 170 Bcf and last year's pull of 117 Bcf for the same week. Net withdrawals from storage posted a significant rebound from last week's storage pull of 70 Bcf.
Storage withdrawals are within the range of analyst's expectations. Expectations for net withdrawals for the report week ranged between 135 and 163 Bcf, averaging 152 Bcf. Shortly after the release of the EIA Weekly Natural Gas Storage Report (WNGSR), prices on the Nymex for the futures contract for March delivery at the Henry Hub drifted down 1¢/MMBtu, to $1.89/MMBtu, within two minutes of the release. The release of this week's storage report was preceded by a surge in trading just moments before the release that increased prices a little over 1¢/MMBtu.
Working gas stocks appear poised to finish the heating season on March 31 near its record-high level. If withdrawals from storage follow the five-year average for the remainder of the heating season, working gas stocks will total 2,164 Bcf on March 31. This would mark only the second time that working gas stocks finished the heating season above the 2,000-Bcf threshold. The previous high for the end of the heating season occurred in 2012, when working gas stocks totaled 2,473 Bcf on March 31, 2012. If withdrawals for the remainder of the heating season follow the 2012 pattern, working gas stocks would total 2,465 Bcf on March 31.
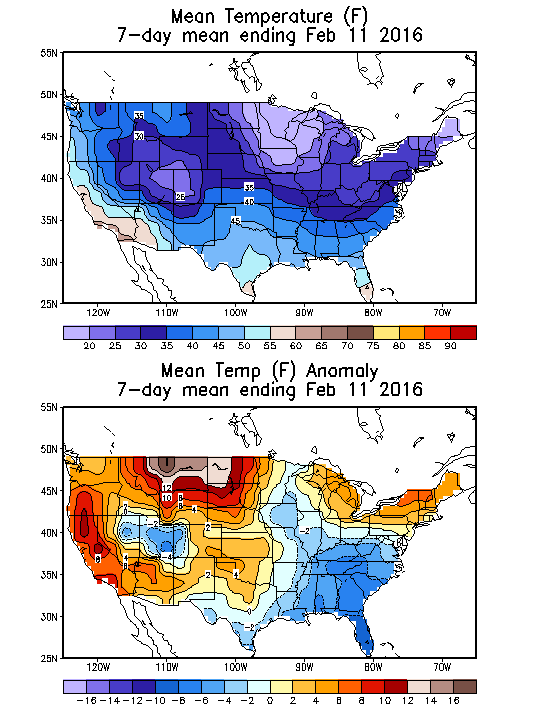
Temperatures during the report week are warmer than normal. Temperatures in the Lower 48 states averaged 37°F during the storage week, 2°F warmer than the normal temperature for the week, but 2°F colder than last year at this time. Temperatures were significantly colder, falling 10%, compared to the previous report week. The warmer-than-normal temperatures continue the pattern that has prevailed during the 2015-16 heating season, with temperatures above normal levels in all but two report weeks. Cumulative heating degree-days since November 1, 2015, are 13% below normal.
See also:
 Japan Ministry of Finance, South Korea International Trade Association, China General Administration of Customs.
March 14, 2016: Image source updated.
| Spot Prices ($/MMBtu) | Thu, 11-Feb |
Fri, 12-Feb |
Mon, 15-Feb |
Tue, 16-Feb |
Wed, 17-Feb |
|---|---|---|---|---|---|
| Henry Hub | 2.12 |
2.07 |
Holiday |
1.92 |
1.91 |
| New York | 5.42 |
8.14 |
Holiday |
1.94 |
2.12 |
| Chicago | 2.16 |
2.05 |
Holiday |
1.90 |
1.91 |
| Cal. Comp. Avg,* | 2.00 |
1.88 |
Holiday |
1.80 |
1.80 |
| Futures ($/MMBtu) | |||||
| March Contract | 1.994 |
1.996 |
Holiday |
1.903 |
1.942 |
| April Contract | 2.061 |
2.030 |
Holiday |
1.969 |
2.011 |
| *Avg. of NGI's reported prices for: Malin, PG&E citygate, and Southern California Border Avg. | |||||
| Source: NGI's Daily Gas Price Index | |||||
| U.S. natural gas supply - Gas Week: (2/10/16 - 2/17/16) | ||
|---|---|---|
Percent change for week compared with: |
||
last year |
last week |
|
| Gross production | 1.46%
|
0.39%
|
| Dry production | 1.45%
|
0.39%
|
| Canadian imports | 15.37%
|
14.24%
|
| West (net) | 8.59%
|
2.00%
|
| Midwest (net) | 78.43%
|
-0.07%
|
| Northeast (net) | -18.21%
|
126.22%
|
| LNG imports | 41.25%
|
205.79%
|
| Total supply | 2.97%
|
2.55%
|
| Source: BENTEK Energy LLC | ||
| U.S. consumption - Gas Week: (2/10/16 - 2/17/16) | ||
|---|---|---|
Percent change for week compared with: |
||
last year |
last week |
|
| U.S. consumption | -5.6%
|
5.8%
|
| Power | 4.8%
|
-8.0%
|
| Industrial | -2.6%
|
1.1%
|
| Residential/commercial | -11.5%
|
16.3%
|
| Total demand | -4.3%
|
5.7%
|
| Source: BENTEK Energy LLC | ||
| Rigs | |||
|---|---|---|---|
Fri, February 12, 2016 |
Change from |
||
last week |
last year |
||
| Oil rigs | 439 |
-6.00% |
-58.43% |
| Natural gas rigs | 102 |
-1.92% |
-66.00% |
| Miscellaneous | 0 |
0.00% |
-100.00% |
| Rig numbers by type | |||
|---|---|---|---|
Fri, February 12, 2016 |
Change from |
||
last week |
last year |
||
| Vertical | 59 |
-1.67% |
-71.90% |
| Horizontal | 433 |
-5.46% |
-57.76% |
| Directional | 49 |
-7.55% |
-60.16% |
| Source: Baker Hughes Inc. | |||
| Working gas in underground storage | ||||
|---|---|---|---|---|
Stocks billion cubic feet (bcf) |
||||
| Region | 2016-02-12 |
2016-02-05 |
change |
|
| East | 568 |
620 |
-52 |
|
| Midwest | 689 |
739 |
-50 |
|
| Mountain | 147 |
151 |
-4 |
|
| Pacific | 255 |
258 |
-3 |
|
| South Central | 1,042 |
1,096 |
-54 |
|
| Total | 2,701 |
2,864 |
-163 |
|
| Source: U.S. Energy Information Administration | ||||
| Working gas in underground storage | |||||
|---|---|---|---|---|---|
Historical comparisons |
|||||
Year ago (2/12/15) |
5-year average (2011-2015) |
||||
| Region | Stocks (Bcf) |
% change |
Stocks (Bcf) |
% change |
|
| East | 464 |
22.6 |
477 |
19.3 |
|
| West | 526 |
31.0 |
534 |
29.0 |
|
| Producing | 132 |
11.4 |
138 |
6.5 |
|
| Total | 2,174 |
24.5 |
2,151 |
25.8 |
|
| Source: U.S. Energy Information Administration | |||||
| Temperature -- heating & cooling degree days (week ending Feb 11) | ||||||||
|---|---|---|---|---|---|---|---|---|
HDD deviation from: |
CDD deviation from: |
|||||||
| Region | HDD Current |
normal |
last year |
CDD Current |
normal |
last year |
||
| New England | 263
|
-5
|
-51
|
0
|
0
|
0
|
||
| Middle Atlantic | 239
|
-17
|
-40
|
0
|
0
|
0
|
||
| E N Central | 272
|
-7
|
-16
|
0
|
0
|
0
|
||
| W N Central | 283
|
-4
|
29
|
0
|
0
|
0
|
||
| South Atlantic | 197
|
28
|
33
|
0
|
-7
|
-2
|
||
| E S Central | 206
|
36
|
43
|
0
|
0
|
0
|
||
| W S Central | 121
|
2
|
33
|
1
|
-3
|
-3
|
||
| Mountain | 188
|
-23
|
72
|
1
|
0
|
-1
|
||
| Pacific | 51
|
-57
|
-3
|
0
|
0
|
0
|
||
| United States | 198
|
-11
|
5
|
0
|
-1
|
-1
|
||
|
Note: HDD = heating degree-day; CDD = cooling degree-day Source: National Oceanic and Atmospheric Administration | ||||||||
Average temperature (°F)
7-Day Mean ending Feb 11, 2016
Source: NOAA/National Weather Service
Deviation between average and normal (°F)
7-Day Mean ending Feb 11, 2016
Source: NOAA/National Weather Service