In the News:
Chinese annual LNG imports decline for first time since imports began
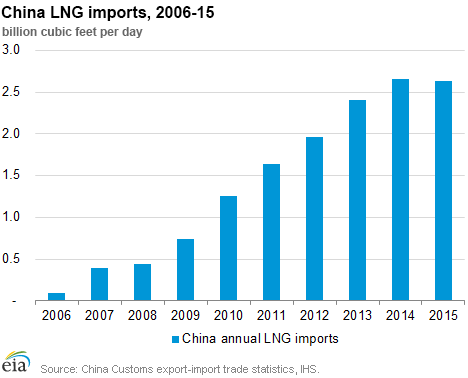
Chinese imports of liquefied natural gas (LNG) declined by 1.1% year-on-year in 2015 for the first time since China began importing LNG in 2006. Chinese LNG imports have grown steadily in the last 10 years, from 0.1 billion cubic feet per day (Bcf/d) in 2006 to 1.3 Bcf/d in 2010, and have more than doubled since then. They reached their peak in 2014 at 2.7 Bcf/d, making China the third-largest LNG importer globally after Japan and South Korea. In 2015, however, LNG imports declined to 2.6 Bcf/d, reflecting in part a slowdown in the growth of the Chinese economy and lower prices of competing fuels.
At the end of 2015, China had 13 LNG regasification import terminals with a combined capacity of 5.4 Bcf/d. Several more terminals are under construction, with a combined capacity of 3.4 Bcf/d. These terminals are scheduled to come online in 2016-19. However, the start-up of several terminals has been delayed because of a lack of downstream demand. For example, construction of Jieyang LNG terminal in Guangdong was completed last year, but the terminal has not been connected to a provincial pipeline network serving end users. The terminal's end users are factories that can also run on liquefied petroleum gas (LPG). Current LPG prices are lower than long-term contractual LNG prices, so LPG is being used to meet the demand. Additionally, many contracts to supply LNG at the new regasification terminals were signed when oil prices were above $100/barrel, which makes long-term LNG prices less competitive than both spot LNG and LPG. Major Chinese oil and gas companies have been trying to postpone shipments of contracted LNG to the new terminals and instead purchase lower-priced spot cargoes.
In November 2015, the Chinese government lowered the ceiling for citygate natural gas prices for nonresidential sectors by $2.95 per Million British thermal units (MMBtu), a decrease of approximately 28%. Lower prices are expected to stimulate natural gas demand growth going forward, particularly in the power generation and transportation sectors.
Overview:
(For the Week Ending Wednesday, January 27, 2016)
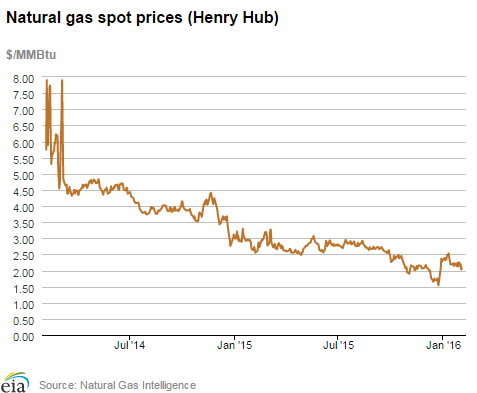
- Natural gas prices generally fell this report week (Wednesday, January 27, to Wednesday, February 3), with more dramatic declines in the northeastern United States. The Henry Hub spot price fell from $2.24 per million British thermal unit (MMBtu) last Wednesday to $2.06/MMBtu yesterday.
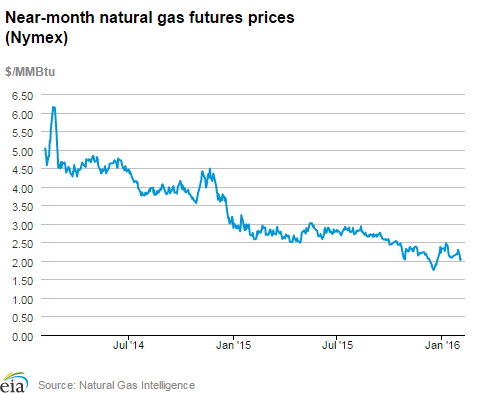
- At the New York Mercantile Exchange (Nymex), the price of the near-month (March 2016) contract fell from $2.189/MMBtu last Wednesday to $2.038/MMBtu yesterday.
- Working natural gas in storage decreased by 152 billion cubic feet (Bcf), declining to 2,934 Bcf as of Friday, January 29. The net withdrawal from storage resulted in storage levels 20% above a year ago and 18% above the five-year (2011–15) average for this week.
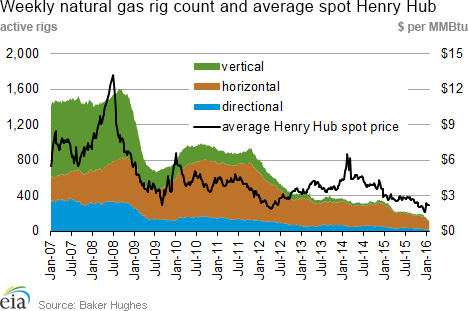
- The total oil and natural gas rig count declined by 18 units, with 619 units in service for the week ending Friday, January 29, according to data from Baker Hughes Incorporated. The oil rig count decreased by 12 units to 498, and the natural gas rig count fell by 6 units to 121. This is the fourth consecutive double-digit weekly decline and the lowest recorded natural gas rig count in the Baker Hughes dataset, which goes back to 1987.
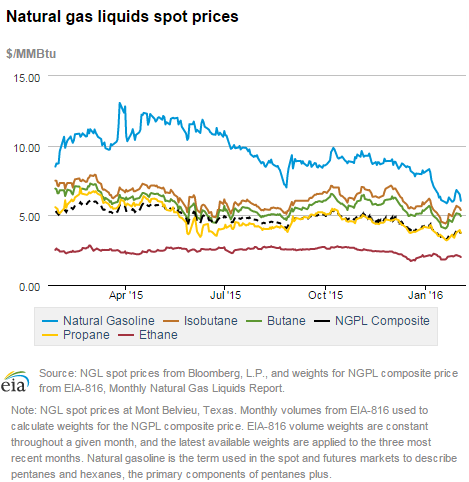
- The natural gas plant liquids (NGPL) composite price at Mont Belvieu, Texas, rose by 9.0% to $3.67/MMBtu for the week ending Friday, January 29. The spot prices of all liquids products increased this week, with ethane up 7.2%; propane, 9.5%; butane, 13.6%; isobutane, 14.2%; and natural gasoline, 4.7%. Despite this week's increase, prices are still relatively low.
Prices/Demand/Supply:
Natural gas prices decline. Temperatures were significantly warmer this report week across most of the country, and natural gas prices fell at most locations across the country. Natural gas markets appeared to reflect Punxsutawney Phil's prediction for an early spring, as temperatures were mild through much of the United States this week, and residential and commercial consumption declined. Likely in response to warmer weather and lower consumption, the Henry Hub spot price fell from $2.24/MMBtu last Wednesday to $2.06/MMBtu yesterday, February 3. At the Chicago Citygate, the spot price fell from $2.22/MMBtu last Wednesday to $2.07/MMBtu yesterday. Similarly, west of the Mississippi River, prices declined as well. In the Rocky Mountains, the spot price at the Opal Hub in Wyoming opened the report week at $2.07/MMBtu and ended yesterday at $2.01/MMBtu. At the PG&E Citygate in California, natural gas prices fell from $2.46/MMBtu last Wednesday to $2.27/MMBtu yesterday.
Northeast prices fall. Prices in the New York and Boston areas generally trade at a premium of several dollars per MMBtu above the Henry Hub spot price in times of high consumption, but tend to trade below this national benchmark in times of milder weather. This week, prices at both these market locations fell below the Henry Hub spot price as temperatures warmed up. At the Algonquin Citygate, which serves Boston, prices fell from $3.52/MMBtu last Wednesday to $1.90/MMBtu yesterday. Boston-area prices fell throughout the week. At Transcontinental Pipeline's Zone 6 trading point serving New York City, prices fell from $2.43/MMBtu last Wednesday to $1.79/MMBtu yesterday.
Marcellus prices decline. Week-over-week, spot prices at major Marcellus trading hubs declined. At Dominion South in northwest Pennsylvania, prices began at $1.60/MMBtu last Wednesday and ended the report week at $1.35/MMBtu yesterday. Similarly, on Transco's Leidy Line in northern Pennsylvania, prices fell from $1.38/MMBtu to $1.22/MMBtu Wednesday-to-Wednesday. At Tennessee Pipeline's Zone 4 Marcellus trading point, prices fell from $1.36/MMBtu to $1.19/MMBtu Wednesday-to-Wednesday.
Nymex prices fall. The price of the Nymex March 2016 contract fell from $2.189/MMBtu last Wednesday to $2.038/MMBtu yesterday. The price of the 12-month strip (the 12 contracts between March 2016 and February 2017) fell from $2.412/MMBtu last Wednesday to $2.384/MMBtu yesterday.
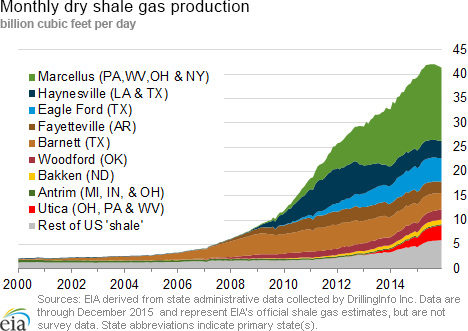
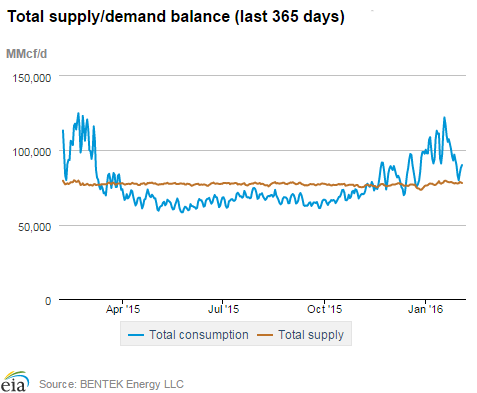
Production rises. Dry natural gas production rose 0.8% week over week and is 0.5% greater than the same week last year, according to Bentek data. Bentek also noted that production from the Northeast (which includes the Marcellus and Utica formations) has been at record levels in recent weeks. U.S. imports of natural gas from Canada fell 12.2%. Declines in imports in the West and Northeast offset a slight increase in imports to the Midwest. LNG sendout declined by 31.1%.
Heating consumption falls substantially. U.S. consumption fell by 14.3%, driven by a large decrease in residential/commercial consumption. According to Bentek data, residential/commercial consumption, which is largely used for heating, fell by 20.6%. Industrial consumption fell by 4.4%, and consumption of natural gas for electric power generation fell by 11.3%, both of which are also affected by changing temperatures, but to a lesser degree than residential and commercial customers. U.S. exports of natural gas to Mexico increased by 10.5%.
Storage
Withdrawals from storage are smaller than average but greater than last year. Net withdrawals from working gas totaled 152 Bcf, falling 8% below the the 5-year (2011–15) average net withdrawal of 165 Bcf. Still, the withdrawal was 40 Bcf larger last year's pull for the same storage week. This marks the fifth consecutive week of triple-digit storage withdrawals in the Lower 48 states. Working gas levels remain relatively high, with a surplus of 490 Bcf (20%) compared with last year at this time, and 445 Bcf (18%) higher than the 5-year average.
Withdrawals from working gas are within market expectations. Market analysts predicted working gas draws totaling 154 Bcf for the week, on average. Prices on the Nymex exhibited their customary increased levels of variability following the release of EIA's Weekly Natural Gas Storage Report at 10:30 a.m. However, trading occurred in an uncharacteristically narrow range, within a penny of $1.99/MMBtu. Trading also was fairly light, with 254 trades occurring at 10:30 a.m., and an average of 49 trades/second in the 30 seconds after the release. This compares to 815 trades in the same period last week, a relatively high volume
Temperatures are warmer than normal during the storage week. Temperatures for the storage report week averaged just less than 36°F, about 3°F above the normal level for this time of year and 2°F below the level reported last year at this time. The warming temperatures decreased heating degree days (HDD) by 12% from the previous week, with reported levels totaling 205 for the week. Cumulative HDD remain about 13% below normal thus far in the heating season, which began November 1.
See also:
| Spot Prices ($/MMBtu) | Thu, 28-Jan |
Fri, 29-Jan |
Mon, 01-Feb |
Tue, 02-Feb |
Wed, 03-Feb |
|---|---|---|---|---|---|
| Henry Hub |
2.12 |
2.25 |
2.18 |
2.03 |
2.06 |
| New York |
2.27 |
2.29 |
2.09 |
1.60 |
1.79 |
| Chicago |
2.13 |
2.29 |
2.20 |
2.05 |
2.07 |
| Cal. Comp. Avg,* |
2.15 |
2.36 |
2.27 |
2.14 |
2.15 |
| Futures ($/MMBtu) | |||||
| March contract |
2.182 |
2.298 |
2.152 |
2.025 |
2.038 |
| April contract |
2.239 |
2.332 |
2.226 |
2.120 |
2.123 |
| *Avg. of NGI's reported prices for: Malin, PG&E citygate, and Southern California Border Avg. | |||||
| Source: NGI's Daily Gas Price Index | |||||
| U.S. natural gas supply - Gas Week: (1/27/16 - 2/3/16) | ||
|---|---|---|
Percent change for week compared with: |
||
last year |
last week |
|
| Gross production | 0.48%
|
0.82%
|
| Dry production | 0.48%
|
0.81%
|
| Canadian imports | -15.73%
|
-12.21%
|
| West (net) | 3.75%
|
-0.39%
|
| Midwest (net) | 24.66%
|
0.73%
|
| Northeast (net) | -86.09%
|
-75.44%
|
| LNG imports | -28.46%
|
-31.06%
|
| Total supply | -1.03%
|
-0.44%
|
| Source: BENTEK Energy LLC | ||
| U.S. consumption - Gas Week: (1/27/16 - 2/3/16) | ||
|---|---|---|
Percent change for week compared with: |
||
last year |
last week |
|
| U.S. consumption | -14.8%
|
-14.3%
|
| Power | -1.2%
|
-11.3%
|
| Industrial | -4.5%
|
-4.4%
|
| Residential/commercial | -25.8%
|
-20.6%
|
| Total demand | -13.3%
|
-13.5%
|
| Source: BENTEK Energy LLC | ||
| Rigs | |||
|---|---|---|---|
Fri, January 29, 2016 |
Change from |
||
last week |
last year |
||
| Oil rigs | 498 |
-2.35% |
-59.28% |
| Natural gas rigs | 121 |
-4.72% |
-62.07% |
| Miscellaneous | 0 |
0.00% |
-100.00% |
| Rig numbers by type | |||
|---|---|---|---|
Fri, January 29, 2016 |
Change from |
||
last week |
last year |
||
| Vertical | 74 |
-3.90% |
-68.51% |
| Horizontal | 487 |
-2.60% |
-58.30% |
| Directional | 58 |
-3.33% |
-58.57% |
| Source: Baker Hughes Inc. | |||
| Working gas in underground storage | ||||
|---|---|---|---|---|
Stocks billion cubic feet (bcf) |
||||
| Region | 2016-01-29 |
2016-01-22 |
change |
|
| East | 641 |
695 |
-54 |
|
| Midwest | 767 |
811 |
-44 |
|
| Mountain | 159 |
164 |
-5 |
|
| Pacific | 271 |
273 |
-2 |
|
| South Central | 1,096 |
1,143 |
-47 |
|
| Total | 2,934 |
3,086 |
-152 |
|
| Source: U.S. Energy Information Administration | ||||
| Working gas in underground storage | |||||
|---|---|---|---|---|---|
Historical comparisons |
|||||
Year ago (1/29/15) |
5-year average (2011-2015) |
||||
| Region | Stocks (Bcf) |
% change |
Stocks (Bcf) |
% change |
|
| East | 559 |
14.7 |
570 |
12.5 |
|
| West | 638 |
20.2 |
644 |
19.1 |
|
| Producing | 133 |
19.5 |
151 |
5.3 |
|
| Total | 2,444 |
20.0 |
2,489 |
17.9 |
|
| Source: U.S. Energy Information Administration | |||||
| Temperature -- heating & cooling degree days (week ending Jan 28) | ||||||||
|---|---|---|---|---|---|---|---|---|
HDD deviation from: |
CDD deviation from: |
|||||||
| Region | HDD Current |
normal |
last year |
CDD Current |
normal |
last year |
||
| New England | 254
|
-21
|
-30
|
0
|
0
|
0
|
||
| Middle Atlantic | 263
|
0
|
-6
|
0
|
0
|
0
|
||
| E N Central | 257
|
-38
|
-12
|
0
|
0
|
0
|
||
| W N Central | 260
|
-51
|
51
|
0
|
0
|
0
|
||
| South Atlantic | 199
|
19
|
23
|
3
|
-5
|
-1
|
||
| E S Central | 201
|
16
|
22
|
0
|
-1
|
0
|
||
| W S Central | 130
|
-5
|
27
|
0
|
-4
|
-1
|
||
| Mountain | 201
|
-25
|
25
|
0
|
-1
|
0
|
||
| Pacific | 93
|
-22
|
23
|
0
|
-1
|
0
|
||
| United States | 205
|
-18
|
11
|
1
|
-1
|
0
|
||
|
Note: HDD = heating degree-day; CDD = cooling degree-day Source: National Oceanic and Atmospheric Administration | ||||||||
Average temperature (°F)
7-Day Mean ending Jan 28, 2016
Source: NOAA/National Weather Service
Deviation between average and normal (°F)
7-Day Mean ending Jan 28, 2016
Source: NOAA/National Weather Service