In the News:
Consumption of natural gas for power generation at record highs
Since January 1, consumption of natural gas for electric power generation (power burn) has averaged 26.0 billion cubic feet per day (Bcf/d), 24% greater than the five-year average and 3% higher than the five-year maximum. While power consumption is typically highest in summer to meet air-conditioning demand, about 39% of all households in the United States rely on electricity as their primary heating source. In the Southeast, where most of the homes use electricity for space heating, natural gas is a relatively large share of the generation mix. However, the growth in power burn this month has occurred despite electricity-weighted heating degree days that were close-to-average nationally and in the Southeast region.
Low natural gas prices and growth in natural gas power generation infrastructure are the main drivers in the consumption growth. This is a continuation of a trend, with 2015 being a record-high year for power burn, according to preliminary Bentek data. Bentek estimated that power burn averaged 26.4 Bcf/d in 2015, 6.8% greater than the next-highest annual average, in 2012.
Nationwide, natural gas-fired generation has been rising, as coal has declined as a share of total generation. In 2015, coal plant retirements accelerated as the Environmental Protection Agency's (EPA) Mercury and Air Toxics Standards (MATS) rules were implemented. Through October 2015, around 11 GW of coal-fired generation was retired, although this generation was likely already running at a reduced capacity factor, meaning that those plants were active for fewer hours a day than before
Overview:
(For the Week Ending Wednesday, January 20, 2016)
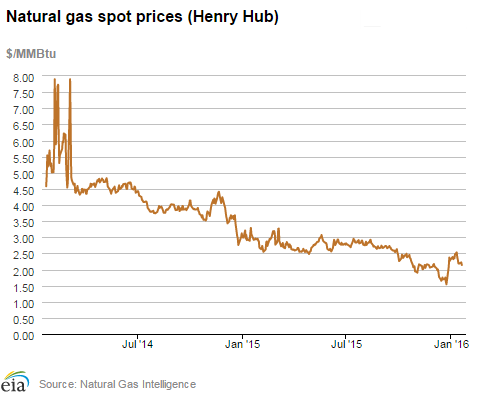
- Outside of the Northeast and the Marcellus region, natural gas spot prices fell at most trading locations during the report week (Wednesday, January 13, to Wednesday, January 20). The Henry Hub spot price fell from $2.30 per million British thermal units (MMBtu) last Wednesday to $2.14/MMBtu yesterday.
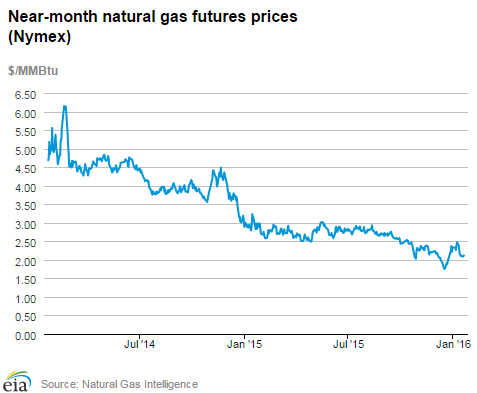
- At the New York Mercantile Exchange (Nymex), the price of the near-month (February 2016) contract decreased by about 15¢, from $2.269/MMBtu last Wednesday to $2.118/MMBtu yesterday.
- Working natural gas in storage decreased by 178 billion cubic feet (Bcf), declining to 3,297 Bcf as of Friday, January 15. The net withdrawal from storage resulted in storage levels 24% above a year ago and 17% above the five-year (2011–15) average for this week.
- The total oil and natural gas rig count declined again, falling by 14 units, with 650 units in service for the week ending Friday, January 15, according to data from Baker Hughes Incorporated. The oil rig count decreased by 1 unit to 515, and the natural gas rig count fell by 13 units to 135. This is the lowest recorded natural gas rig count in the Baker Hughes dataset, which goes back to 1987.
- The natural gas plant liquids (NGPL) composite price at Mont Belvieu, Texas, fell by 13.0% to $3.63/MMBtu for the week ending Friday, January 15. The spot prices of all liquids products fell this week, with ethane falling 6.0%, propane falling 12.6%, butane falling 14.7%, isobutane falling 14.9%, and natural gasoline falling 16.7%. The drop in prices most likely relates to the ongoing decline in crude oil prices.
Prices/Demand/Supply:
Prices fall slightly at most points outside of the Northeast and Marcellus region. The Henry Hub spot price fell to $2.14/MMBtu yesterday from $2.30 last Wednesday. Price patterns at other major trading hubs were comparable to Henry Hub. The natural gas price at the Chicago Citygate began the week last Wednesday at $3.32/MMBtu and closed at $2.21/MMBtu yesterday. Temperatures were similar overall to last report week, but a bit warmer in the states bordering Mexico, and a bit colder in the Northeast.
On the West Coast, the price at the SoCal Citygate, serving customers in Southern California, fell to $2.38/MMBtu yesterday from $2.51/MMBtu last Wednesday. Southern California Gas Company (SoCal), a major utility in Southern California, has been experiencing a leak in one of its large natural gas storage fields, which started October 23 and is ongoing. The governor's office is releasing regular statements on the leak, and SoCal anticipates having the leak plugged sometime in February. While disruptive in the local community and broadly controversial, the leak has not had a noticeable effect on prices.
Northeast prices up. In the Northeast, prices at major market hubs increased Wednesday-to-Wednesday. Temperatures for the report period reached their lowest in the Northeast on Tuesday, but prices generally peaked yesterday. At Algonquin Citygate, which serves Boston, prices rose Wednesday-to-Wednesday from $4.40/MMBtu to $5.55/MMBtu. At the same time, prices at Tennessee Zone 6 200L, serving lower New England, rose from $4.38/MMBtu to $5.64/MMBtu.
Marcellus prices flat to up. Week-over-week, spot prices at major Marcellus trading hubs trended flat to increasing. At Dominion South in northwest Pennsylvania, prices began at $1.38/MMBtu last Wednesday and ended the report week at $1.61/MMBtu yesterday. Similarly, on Transco's Leidy Line in northern Pennsylvania, prices increased from $1.38/MMBtu to $1.40/MMBtu Wednesday-to-Wednesday, and were stable throughout the week. Noticeably, the Marcellus prices are well below the benchmark Henry Hub prices in Louisiana ($2.14 yesterday).
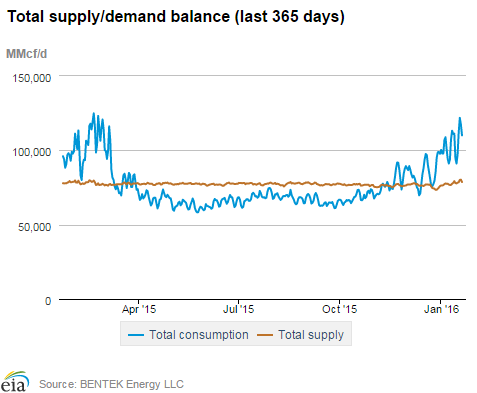
Production rises. Dry natural gas production rose 0.3% week-on-week, according to Bentek Energy. Imports of natural gas from Canada to the United States rose 10.7% from last week, contributing an additional 0.6 Bcf/d of supply. LNG sendout rose 75.6% this week, as Cove Point LNG facility in Maryland re-gasified some of its stocks to meet elevated consumption. Overall supply was up 1.6% week-on-week.
Consumption rises. Total U.S. consumption rose 3.1% week-on-week, according to Bentek data. Residential and commercial consumption drove the increase, rising 7.9%, or 3.8 Bcf/d over the report week. As typically happens in cold weather, industrial consumption also rose, increasing by 1.3%. Power burn, though still elevated compared to last year at this time, fell slightly this week, decreasing by 3.0%. The decrease in power burn was driven by the Southwest, which experienced more mild temperatures this report week compared to last. Exports to Mexico fell somewhat, declining by 4.5% for the period.
Storage
Net storage withdrawals are inline with the five-year average withdrawals. The net withdrawal for the storage week was 178 Bcf, compared with the 168 Bcf net storage withdrawal reported the previous week. This withdrawal compares with the five-year (2011–15) average net withdrawal of 177 Bcf for the week and last year's withdrawal of 220 Bcf for the same week. The working natural gas inventory for the storage week ending January 15 totaled 3,297 Bcf, which was 629 Bcf (24%) higher than last year at this time and 473 Bcf (17%) higher than the five-year average for this week.
Storage withdrawals are similar to market expectations. Market expectations, on average, called for a withdrawal of 181 Bcf for this week. When the EIA storage report was released at 10:30 a.m. on January 21, the February Nymex price fell about 5¢/MMBtu, to about $2.11/MMBtu, and dropped two cents further in the following hour.
Temperatures during the storage report week are close to normal. Temperatures in the Lower 48 states averaged 34°F for the storage report week, 1°F warmer than the 30-year normal temperature and 7°F warmer than the average temperature during the same week last year. There were 215 population-weighted heating degree days (HDD) during this report week, 21 HDD more than the five-year average and 46 HDD fewer than during the same period last year.
See also:
")
| Spot Prices ($/MMBtu) | Thu, 14-Jan |
Fri, 15-Jan |
Mon, 18-Jan |
Tue, 19-Jan |
Wed, 20-Jan |
|---|---|---|---|---|---|
| Henry Hub | 2.19 |
2.18 |
Holiday |
2.22 |
2.14 |
| New York | 2.17 |
6.58 |
Holiday |
4.03 |
3.58 |
| Chicago | 2.29 |
2.33 |
Holiday |
2.28 |
2.21 |
| Cal. Comp. Avg,* | 2.34 |
2.29 |
Holiday |
2.30 |
2.27 |
| Futures ($/MMBtu) | |||||
| February Contract | 2.139 |
2.100 |
Holiday |
2.091 |
2.118 |
| March Contract | 2.180 |
2.127 |
Holiday |
2.108 |
2.123 |
| *Avg. of NGI's reported prices for: Malin, PG&E citygate, and Southern California Border Avg. | |||||
| Source: NGI's Daily Gas Price Index | |||||

| U.S. natural gas supply - Gas Week: (1/13/16 - 1/20/16) | ||
|---|---|---|
Percent change for week compared with: |
||
last year |
last week |
|
| Gross production | 0.54%
|
0.32%
|
| Dry production | 0.54%
|
0.32%
|
| Canadian imports | 3.67%
|
10.72%
|
| West (net) | -0.98%
|
0.86%
|
| Midwest (net) | 32.62%
|
13.43%
|
| Northeast (net) | -24.68%
|
46.63%
|
| LNG imports | 97.80%
|
75.65%
|
| Total supply | 1.36%
|
1.59%
|
| Source: BENTEK Energy LLC | ||
| U.S. consumption - Gas Week: (1/13/16 - 1/20/16) | ||
|---|---|---|
Percent change for week compared with: |
||
last year |
last week |
|
| U.S. consumption | 11.6%
|
3.4%
|
| Power | 13.2%
|
-3.0%
|
| Industrial | 2.4%
|
1.3%
|
| Residential/commercial | 15.3%
|
7.9%
|
| Total demand | 12.5%
|
3.1%
|
| Source: BENTEK Energy LLC | ||
| Rigs | |||
|---|---|---|---|
Fri, January 15, 2016 |
Change from |
||
last week |
last year |
||
| Oil rigs | 515 |
-0.19% |
-62.30% |
| Natural gas rigs | 135 |
-8.78% |
-56.45% |
| Miscellaneous | 0 |
0.00% |
0.00% |
| Rig numbers by type | |||
|---|---|---|---|
Fri, January 15, 2016 |
Change from |
||
last week |
last year |
||
| Vertical | 77 |
-4.94% |
-71.48% |
| Horizontal | 511 |
-1.54% |
-59.22% |
| Directional | 62 |
-3.13% |
-59.48% |
| Source: Baker Hughes Inc. | |||
| Working gas in underground storage | ||||
|---|---|---|---|---|
Stocks billion cubic feet (bcf) |
||||
| Region | 2016-01-15 |
2016-01-08 |
change |
|
| East | 758 |
802 |
-44 |
|
| Midwest | 879 |
942 |
-63 |
|
| Mountain | 170 |
177 |
-7 |
|
| Pacific | 281 |
295 |
-14 |
|
| South Central | 1,209 |
1,259 |
-50 |
|
| Total | 3,297 |
3,475 |
-188 |
|
| Source: U.S. Energy Information Administration | ||||
| Working gas in underground storage | |||||
|---|---|---|---|---|---|
Historical comparisons |
|||||
Year ago (1/15/15) |
5-year average (2011-2015) |
||||
| Region | Stocks (Bcf) |
% change |
Stocks (Bcf) |
% change |
|
| East | 639 |
18.6 |
667 |
13.6 |
|
| West | 720 |
22.1 |
755 |
16.4 |
|
| Producing | 137 |
24.1 |
163 |
4.3 |
|
| Total | 2,668 |
23.6 |
2,824 |
16.7 |
|
| Source: U.S. Energy Information Administration | |||||
| Temperature -- heating & cooling degree days (week ending Jan 14) | ||||||||
|---|---|---|---|---|---|---|---|---|
HDD deviation from: |
CDD deviation from: |
|||||||
| Region | HDD Current |
normal |
last year |
CDD Current |
normal |
last year |
||
| New England | 235
|
-38
|
-91
|
0
|
0
|
0
|
||
| Middle Atlantic | 229
|
-32
|
-89
|
0
|
0
|
0
|
||
| E N Central | 282
|
-14
|
-82
|
0
|
0
|
0
|
||
| W N Central | 318
|
0
|
-48
|
0
|
0
|
0
|
||
| South Atlantic | 168
|
-16
|
-60
|
4
|
-4
|
-1
|
||
| E S Central | 181
|
-9
|
-61
|
0
|
-2
|
0
|
||
| W S Central | 135
|
-6
|
-69
|
0
|
-3
|
0
|
||
| Mountain | 247
|
12
|
42
|
0
|
0
|
0
|
||
| Pacific | 126
|
2
|
40
|
0
|
0
|
0
|
||
| United States | 215
|
-11
|
-46
|
1
|
-1
|
0
|
||
|
Note: HDD = heating degree-day; CDD = cooling degree-day Source: National Oceanic and Atmospheric Administration | ||||||||
Average temperature (°F)
7-Day Mean ending Jan 14, 2016
Source: NOAA/National Weather Service
Deviation between average and normal (°F)
7-Day Mean ending Jan 14, 2016
Source: NOAA/National Weather Service