In the News:
Basis differential narrows in Marcellus
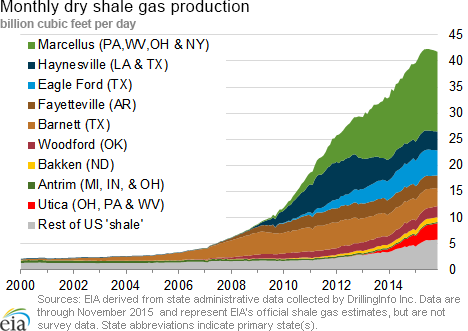
At the Marcellus-shale area trading points, natural gas prices normally trade well below the Henry Hub national benchmark price because of the area's high gas production and limited pipeline takeaway capacity. The difference between the Marcellus pricing points and the Henry Hub, commonly referred to as the basis differential, has narrowed somewhat in recent months as new pipeline projects have come online and consumption of natural gas for heating has ramped up. While prices in the region are still very low, trading under $1.50 per million British thermal units (MMBtu), since November they have moved somewhat closer to the Henry Hub price. The price at Transco's Leidy Hub, for example, has averaged 89¢ below the Henry Hub since December 1. In July of 2015, on the other hand, the differential was much larger, averaging $1.65/MMBtu for the month.
In recent months, several new pipeline infrastructure projects and expansions have begun operation. For example, Texas Eastern Transmission Company's (Tetco) OPEN project added 550 million cubic feet (MMcf/d) of pipeline takeaway capacity out of Ohio and began full service in early November 2015. Other recent pipeline additions include Columbia Gas Pipeline's East Side Expansion, a 310-MMcf/d project that flows natural gas produced in Pennsylvania to Middle Atlantic markets; and Tennessee Gas Pipeline's Broad Run Flexibility Project, a 590-MMcf/d project originating in West Virginia that moves natural gas to the Gulf Coast states. Transco's Leidy Line project also began service in December, and flows gas from the Marcellus to Transco's main pipeline extending from Texas to New York. Bentek Energy noted that the effect of these new projects was somewhat limited in November, but as heating consumption increased later in 2015, Northeast production (which includes Marcellus) increased as well, setting records in December. Bentek estimated production from the Northeast came close to 22 Bcf/d in December.
Overview:
(For the Week Ending Wednesday, January 6, 2016)
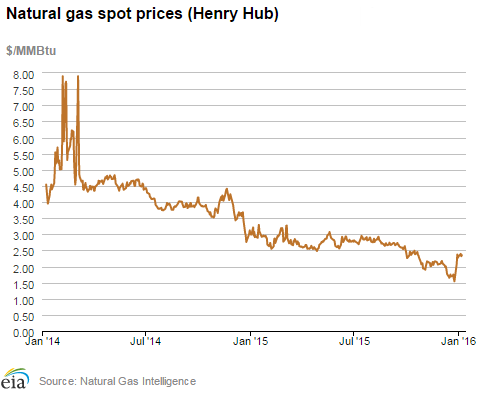
- Natural gas price movements were mixed across the country for the report week (Wednesday, December 30, through Wednesday, January 6), with warmer temperatures in the West and seasonably cold temperatures in the East. The Henry Hub spot price began the week at $2.27/MMBtu last Wednesday and ended at $2.35/MMBtu yesterday.
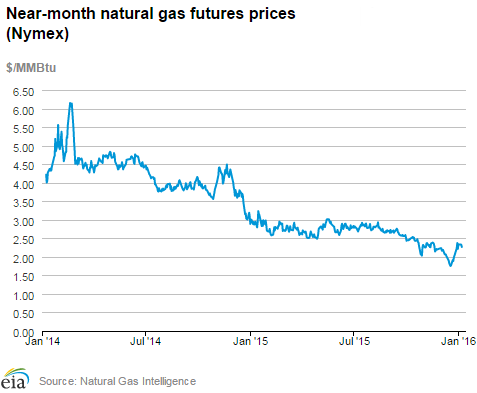
- At the New York Mercantile Exchange (Nymex), the February Nymex price began at $2.214/MMBtu last Wednesday and settled at $2.267/MMBtu yesterday.
- Market demand for natural gas from storage for the week ending January 1 totaled 117 Bcf. This contributed to a decline in the storage level to 3,643 Bcf, which was 17% above a year ago and 15% greater than the five-year (2011–15) average for this week. However, because of a storage operator's reclassification of 4 Bcf from base gas to working gas, the actual inventory decline was 113 Bcf.
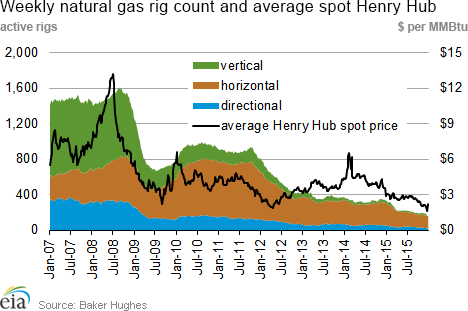
- The total oil and natural gas rig count fell by 2 units this week, with 698 units in service for the week ending Thursday, December 31, according to data from Baker Hughes Incorporated. The oil rig count accounted for the entire decline, decreasing by 2 units to 536, and the natural gas rig count maintained 162 active units. The oil and natural gas rig count has not been this low since September 1999.
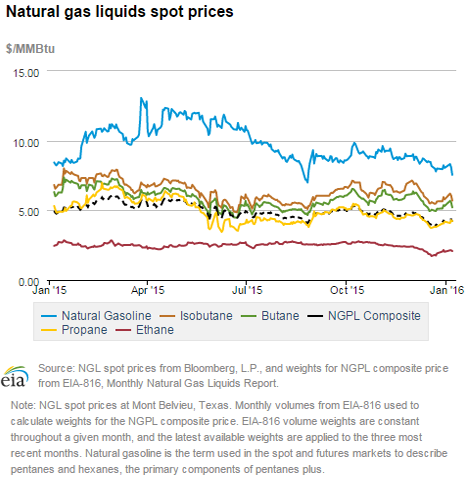
- The natural gas plant liquids composite price at Mont Belvieu, Texas, increased by 6% to $4.21/MMBtu for the week ending Friday, January 1. Natural gas liquids spot prices increased across the board: ethane increased by 14%, propane rose by 7.0%, butane and isobutane each increased by 5%, and natural gasoline rose by 2%.
Prices/Demand/Supply:
Henry Hub increases with more seasonal temperatures. After closing at its lowest level since December 1998 at $1.54/MMBtu on December 24, heading into a holiday weekend, Henry Hub prices generally increased over the past two weeks. The Henry Hub price started the report week last Wednesday at $2.27/MMBtu and closed at $2.35/MMBtu yesterday. Despite this increase, Henry Hub prices remain relatively low. The average Henry Hub price in 2015 was $2.61/MMBtu, the lowest annual average level since 1999.
Spot prices reflect regional temperature differences. Over the report week, the eastern half of the country largely experienced its first taste of colder-than-average temperatures this winter, while temperatures warmed in the West. After starting the report week with temperatures below freezing across much of the region, prices at trading locations in the Rocky Mountains fell as temperatures neared 50° F in the last half of the report week. The Opal price in southwest Wyoming decreased from $2.57/MMBtu to $2.43/MMBtu. West of the Rocky Mountains, the California regional average price fell from $2.69/MMBtu last Wednesday to $2.62/MMBtu yesterday. This price change was driven by a 15¢/MMBtu decrease over the report week at the Malin trading location, at the border of California and Oregon.
Prices increase at northeastern locations with the arrival of colder-than-normal temperatures. New England prices increased as temperatures stayed below freezing across most of the region on January 5. The Algonquin Citygate price, in Boston, settled at $4.65/MMBtu last Wednesday and closed at $7.92/MMBtu on Monday, the highest price since March 2015. As temperatures rebounded slightly in the last couple days of the report week, prices decreased, and Algonquin closed at $4.76/MMBtu yesterday. Similarly, at Transco Zone 6 NY, serving New York City, prices increased from $2.05/MMBtu last Wednesday to $3.01/MMBtu yesterday, and hit an intra-week high of $7.21/MMBtu on Tuesday.
Marcellus prices remain low. Marcellus prices generally had similar movements to those in the Northeast. At Tennessee's Zone 4 Marcellus trading point, prices began at $1.09/MMBtu last Wednesday, and increased during the last half of the report week, to close at to $1.31/MMBtu yesterday. Similarly, on Transco's Leidy Line, prices increased from $1.19/MMBtu to $1.34/MMBtu Wednesday-to-Wednesday, after peaking at $1.44/MMBtu on Monday.
Nymex prices increase. At the Nymex, the February contract began at $2.214/MMBtu last Wednesday and ended the report week up slightly more than 5¢, closing at $2.267/MMBtu yesterday. Similarly, the 12-month strip, which averages the February 2016 through January 2017 Nymex prices, closed at $2.502/MMBtu yesterday, about 6¢higher than last week.
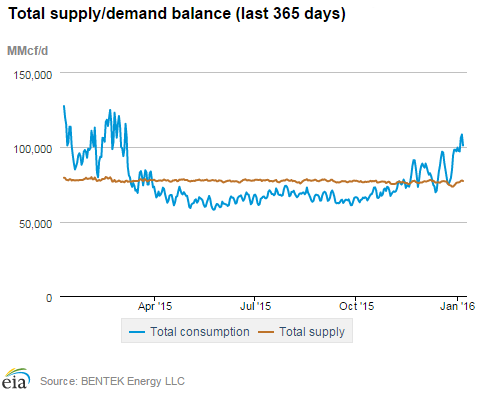
Supply increase. According to data from Bentek Energy, natural gas supply this week increased week-over-week, with increases from all sources of supply. Dry natural gas production increased by 2%, with Northeast production growing over the report week. Imports of natural gas from Canada increased by 17%. The increase in imports was driven by the Northeast region. Last week, in the Northeast, the United States exported more gas to Canada than it imported. This report week, the United States imported more gas than it exported to Canada, with U.S. net imports of gas from Canada in that region averaging 0.9 billion cubic feet per day (Bcf/d) over the report week. Liquefied natural gas sendout remained at minimal levels.
Consumption tops 105 Bcf on Tuesday. U.S. consumption of natural gas increased by 17% compared to the previous report week, led by an increase in the residential/commercial sector. Residential/commercial consumption increased by 33%, as colder temperatures increased the heating load. Consumption in other sectors increased as well; consumption for power generation increased by 3%, and industrial consumption increased by 5%. Exports to Mexico grew by 8%, exceeding 3 Bcf/d during most of the report week.
Storage
Net storage withdrawals are smaller than the five-year average. The net withdrawal for the storage week was 117 Bcf compared with the 58 Bcf net storage withdrawal reported the previous week. This withdrawal compares with the five-year (2011–15) average net withdrawal of 129 Bcf for the week and last year's withdrawal of 116 Bcf for the same week. A 4 Bcf reclassification from base gas to working gas in the South Central Nonsalt resulted in an overall inventory level change of 113 Bcf. The working natural gas inventory for the storage week ending January 1 totaled 3,643 Bcf, which was 535 Bcf (17%) higher than last year at this time and 464 Bcf (15%) higher than the five-year average for this week.
Storage withdrawals are larger than market expectations. Market expectations, on average, called for a withdrawal of 97 Bcf for this week. When the EIA storage report was released at 10:30 a.m. on January 7, the February Nymex price rose about 5¢/MMBtu, to about $2.37/MMBtu and remained close to that level in the following hour.
Temperatures during the storage report week are warmer than normal. Temperatures in the Lower 48 states averaged 42° for the storage report week, 8° warmer than the 30–year normal temperature and 6° warmer than the average temperature during the same week last year. There were 167 population-weighted heating degree days (HDD) during this report week, 22 HDD fewer than the five-year average and 33 HDD fewer than during the same period last year.
See also:

| Spot Prices ($/MMBtu) | Thu, 17-Dec |
Fri, 18-Dec |
Mon, 21-Dec |
Tue, 22-Dec |
Wed, 23-Dec |
|---|---|---|---|---|---|
| Henry Hub | 1.75 |
1.70 |
1.70 |
1.75 |
1.62 |
| New York | 1.74 |
1.80 |
1.53 |
1.02 |
0.96 |
| Chicago | 1.89 |
1.79 |
1.86 |
1.79 |
1.72 |
| Cal. Comp. Avg,* | 2.25 |
2.13 |
2.26 |
2.19 |
2.22 |
| Futures ($/MMBtu) | |||||
| January Contract | 1.755 |
1.767 |
1.911 |
1.888 |
1.983 |
| February Contract | 1.873 |
1.869 |
1.987 |
1.955 |
2.036 |
| *Avg. of NGI's reported prices for: Malin, PG&E citygate, and Southern California Border Avg. | |||||
| Source: NGI's Daily Gas Price Index | |||||
| Spot Prices ($/MMBtu) | Thu, 24-Dec |
Fri, 25-Dec |
Mon, 28-Dec |
Tue, 29-Dec |
Wed, 30-Dec |
|---|---|---|---|---|---|
| Henry Hub | 1.54 |
Holiday |
2.08 |
2.37 |
2.27 |
| New York | 0.90 |
Holiday |
1.97 |
2.04 |
2.05 |
| Chicago | 1.69 |
Holiday |
2.27 |
2.51 |
2.37 |
| Cal. Comp. Avg,* | 2.37 |
Holiday |
2.81 |
2.95 |
2.69 |
| Futures ($/MMBtu) | |||||
| January Contract | 2.029 |
Holiday |
2.228 |
2.372 |
Expired |
| February Contract | 2.079 |
Holiday |
2.256 |
2.370 |
2.214 |
| *Avg. of NGI's reported prices for: Malin, PG&E citygate, and Southern California Border Avg. | |||||
| Source: NGI's Daily Gas Price Index | |||||
| Spot Prices ($/MMBtu) | Thu, 31-Dec |
Fri, 1-Jan |
Mon, 4-Jan |
Tue, 5-Jan |
Wed, 6-Jan |
|---|---|---|---|---|---|
| Henry Hub | 2.31 |
Holiday |
2.39 |
2.32 |
2.35 |
| New York | 2.96 |
Holiday |
7.21 |
3.61 |
3.01 |
| Chicago | 2.45 |
Holiday |
2.48 |
2.36 |
2.42 |
| Cal. Comp. Avg,* | 2.66 |
Holiday |
2.67 |
2.58 |
2.62 |
| Futures ($/MMBtu) | |||||
| February Contract | 2.337 |
Holiday |
2.334 |
2.325 |
2.267 |
| March Contract | 2.363 |
Holiday |
2.350 |
2.346 |
2.289 |
| *Avg. of NGI's reported prices for: Malin, PG&E citygate, and Southern California Border Avg. | |||||
| Source: NGI's Daily Gas Price Index | |||||
| U.S. natural gas supply - Gas Week: (12/30/15 - 1/6/16) | ||
|---|---|---|
Percent change for week compared with: |
||
last year |
last week |
|
| Gross production | 0.57%
|
2.37%
|
| Dry production | 0.56%
|
2.35%
|
| Canadian imports | -12.34%
|
17.17%
|
| West (net) | -1.37%
|
-2.71%
|
| Midwest (net) | -22.04%
|
-3.15%
|
| Northeast (net) | N/A
|
N/A
|
| LNG imports | 8.12%
|
33.67%
|
| Total supply | -0.50%
|
3.39%
|
| Source: BENTEK Energy LLC | ||
| U.S. consumption - Gas Week: (12/30/15 - 1/6/16) | ||
|---|---|---|
Percent change for week compared with: |
||
last year |
last week |
|
| U.S. consumption | -5.6%
|
16.6%
|
| Power | 7.0%
|
3.2%
|
| Industrial | -3.4%
|
5.0%
|
| Residential/commercial | -12.2%
|
33.1%
|
| Total demand | -4.4%
|
16.4%
|
| Source: BENTEK Energy LLC | ||
| Rigs | |||
|---|---|---|---|
Fri, January 01, 2016 |
Change from |
||
last week |
last year |
||
| Oil rigs | 536 |
-0.37% |
-63.83% |
| Natural gas rigs | 162 |
0.00% |
-50.61% |
| Miscellaneous | 0 |
0.00% |
-100.00% |
| Rig numbers by type | |||
|---|---|---|---|
Fri, January 01, 2016 |
Change from |
||
last week |
last year |
||
| Vertical | 89 |
3.49% |
-70.33% |
| Horizontal | 549 |
-0.90% |
-58.91% |
| Directional | 60 |
0.00% |
-65.71% |
| Source: Baker Hughes Inc. | |||
| Working gas in underground storage | ||||
|---|---|---|---|---|
Stocks billion cubic feet (bcf) |
||||
| Region | 2016-01-01 |
2015-12-25 |
change |
|
| East | 857 |
876 |
-19 |
|
| Midwest | 983 |
1,025 |
-42 |
|
| Mountain | 185 |
195 |
-10 |
|
| Pacific | 313 |
338 |
-25 |
|
| South Central | 1,305 |
1,322 |
-17 |
|
| Total | 3,643 |
3,756 |
-113 |
|
| Source: U.S. Energy Information Administration | ||||
| Working gas in underground storage | |||||
|---|---|---|---|---|---|
Historical comparisons |
|||||
Year ago (1/1/15) |
5-year average (2011-2015) |
||||
| Region | Stocks (Bcf) |
% change |
Stocks (Bcf) |
% change |
|
| East | 741 |
15.7 |
756 |
13.4 |
|
| West | 854 |
15.1 |
866 |
13.5 |
|
| Producing | 154 |
20.1 |
180 |
2.8 |
|
| Total | 3,108 |
17.2 |
3,179 |
14.6 |
|
| Source: U.S. Energy Information Administration | |||||
| Temperature -- heating & cooling degree days (week ending Dec 31) | ||||||||
|---|---|---|---|---|---|---|---|---|
HDD deviation from: |
CDD deviation from: |
|||||||
| Region | HDD Current |
normal |
last year |
CDD Current |
normal |
last year |
||
| New England | 174
|
-86
|
-26
|
0
|
0
|
0
|
||
| Middle Atlantic | 143
|
-105
|
-51
|
0
|
0
|
0
|
||
| E N Central | 197
|
-85
|
-44
|
0
|
0
|
0
|
||
| W N Central | 277
|
-29
|
-20
|
0
|
0
|
0
|
||
| South Atlantic | 44
|
-131
|
-87
|
31
|
25
|
21
|
||
| E S Central | 62
|
-119
|
-95
|
11
|
10
|
11
|
||
| W S Central | 106
|
-29
|
-35
|
10
|
8
|
9
|
||
| Mountain | 293
|
58
|
13
|
0
|
0
|
0
|
||
| Pacific | 169
|
43
|
21
|
0
|
0
|
0
|
||
| United States | 167
|
-51
|
-33
|
8
|
7
|
6
|
||
|
Note: HDD = heating degree-day; CDD = cooling degree-day Source: National Oceanic and Atmospheric Administration | ||||||||
Average temperature (°F)
7-Day Mean ending Dec 31, 2015
Source: NOAA/National Weather Service
Deviation between average and normal (°F)
7-Day Mean ending Dec 31, 2015
Source: NOAA/National Weather Service