In the News:
Nuclear power refueling over next few months may increase power sector gas consumption
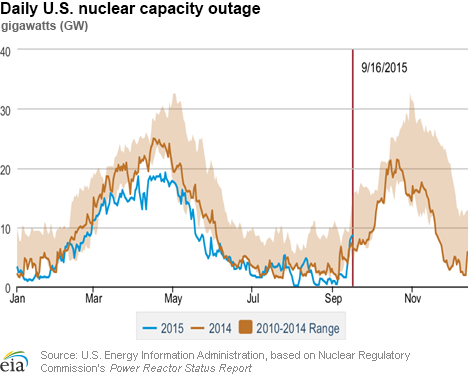
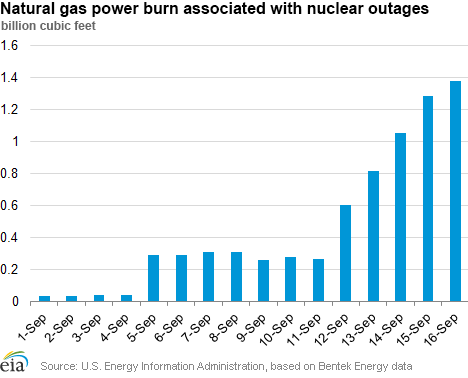
With 8.6 gigawatts (GW), or 9%, of nuclear power capacity offline on September 16, the 2015 fall nuclear refueling season is underway. Bentek Energy estimates that currently as much as 1.4 billion cubic feet (Bcf) of natural gas consumed in the electric power sector (power burn) can be attributed to the nuclear outages. Of the 99 nuclear power reactors operating in the United States, 30 reactors in 20 states, with a combined capacity of 30 GW, are scheduled to refuel between September and December, according to Bentek. If all of this lost nuclear generation is replaced by natural gas generation, it will require, on average, 1.9 Bcf/d of natural gas to meet the increase in demand. In comparison, power sector consumption averaged 28 Bcf/d during the first week of September, when nuclear outages were relatively low.
Nuclear power plant operators typically refuel during the low-demand seasons of spring and fall in order to limit the effect of these outages and to minimize the cost of replacement power. Most nuclear power reactors refuel every 18 to 24 months, during which time one-third to one-half of the plant's fuel rods are replaced. Although the refueling process can be completed in as few as 10 days, outage periods are typically longer because of noncritical maintenance that is completed concurrently with refueling to minimize downtime over the course of the year. Outages are coordinated to ensure that replacement power sources are available.
Outage levels were below the previous five-year range (2010-14) for much of the spring this year and consistently lower than last year. In contrast, refueling operations for this fall are scheduled to be 30% more than during the same period in 2014, when 23 reactors were refueled.
While not all of the 30 nuclear power reactors will be shut down at the same time, 16 are expected to be offline in the first week of October, causing the loss of 18.2 GW that typically operates at 90.7% of capacity. Assuming this capacity is replaced by gas-fired combined cycle generation, which typically runs at heat rates of 7,667 Btu/kWh (or 44% thermal efficiency), this would increase power burn by 2.96 Bcf/d.
Overview:
(For the Week Ending Wednesday, September 16, 2015)
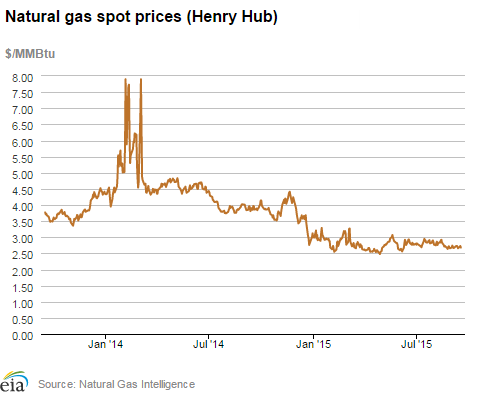
- Natural gas prices declined in most market locations across the country over the report week (Wednesday, September 9, through Wednesday, September 16), and remained relatively low. The Henry Hub spot price began the week at $2.73 per million British thermal units (MMBtu) last Wednesday and ended the week at $2.68/MMBtu.
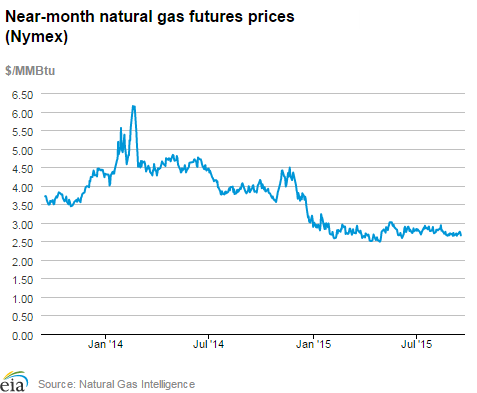
- At the New York Mercantile Exchange (Nymex), the price of the near-month futures contract (October 2015) began the week at $2.651/MMBtu and ended the report week up slightly, at $2.660/MMBtu yesterday.
- Working natural gas in storage increased to 3,334 Bcf as of Friday, September 11. A net injection into storage of 73 Bcf for the week resulted in storage levels 16% above a year ago and 4% above the five-year average for this week.
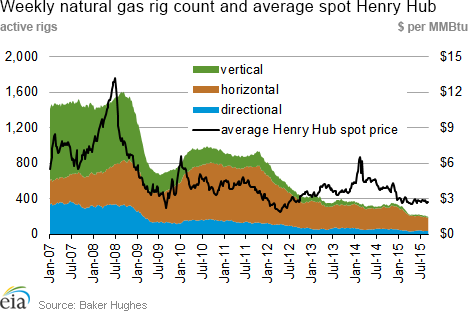
- The total oil and natural gas rig count fell by 16 from the previous week, with 848 units in service for the week ending Friday, September 11, and was 1,083 rigs below the same week in 2014, according to data from Baker Hughes Incorporated. The oil rig count decreased by 10 units to 652, and the natural gas rig count declined by 6 to 196 units.
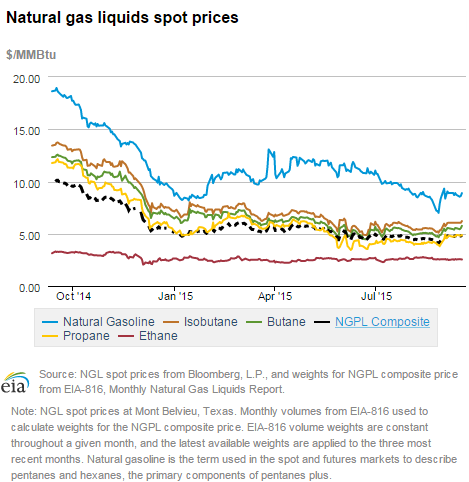
- The natural gas plant liquids composite price at Mont Belvieu increased slightly, by 4¢ (0.7%) to $4.79/MMBtu for the week ending September 11. Natural gasoline prices declined by 7¢ (0.7%), while prices of ethane remained unchanged, and prices of propane, butane, and isobutane increased moderately, by 1.7%, 0.6%, and 2.1%, respectively.
Prices/Demand/Supply:
Prices outside the Northeast decline slightly. Natural gas prices decreased in most market locations last week, as late summer heat was replaced by cooler fall weather across most of the country. The Henry Hub spot price began the report week at $2.73/MMBtu last Wednesday and settled yesterday at $2.68/MMBtu. Prices at other locations also declined. In the West, prices at PG&E Citygate, serving Northern California, fell by 2% from $3.19/MMBtu last Wednesday to $3.14/MMBtu yesterday. Prices at the Chicago Citygate declined by 5¢, closing at $2.70/MMBtu yesterday. Cheyenne, in southeast Wyoming, declined by 3¢, to $2.54/MMBtu. Other price points, with the exception of the Northeast, saw similar declines, by less than a dime in most locations.
Northeast prices mixed. In the Northeast, prices fluctuated during the report week in response to varying temperatures. Prices along the Iroquois Gas Transmission pipeline at Waddington and Zone 2 trading points, serving customers from the U.S./Canada border in upstate New York to the interconnection with the Con Edison system in New York City, were the highest in the country, and remained relatively unchanged, closing the report week yesterday at $3.08/MMBtu and $3.15/MMBtu, respectively. In contrast, New England saw large price declines, with gas prices at the Algonquin Citygate, which serves Boston, falling from $3.71/MMBtu last Wednesday to $1.93/MMBtu on Tuesday, and closing the week at $2.57/MMBtu yesterday. Similarly, at the Tennessee Zone 6 200L serving lower New England, prices fluctuated during the report week, starting last Wednesday at $3.58/MMBtu, falling to $1.99/MMBtu on Tuesday, and settling yesterday at $2.60/MMBtu. At Transcontinental Pipeline's Zone 6 trading point for New York City delivery, the spot price fluctuated during the report week, but remained unchanged Wednesday-to-Wednesday, closing at $2.66/MMBtu yesterday.
Most Marcellus prices increase slightly, but remain low. Most Marcellus-area prices increased by around a dime through the report week. At Tennessee's Zone 4 Marcellus location, prices increased from $1.14/MMBtu last Wednesday to $1.24/MMBtu yesterday. On the Transco Leidy Line, prices increased from $1.20/MMBtu last Wednesday to $1.28/MMBtu yesterday. At Dominion South, which serves customers in portions of Pennsylvania, Ohio, Maryland, West Virginia, and Virginia, prices decreased by 5¢, falling from $1.41/MMBtu to $1.36/MMBtu.
The Ohio Pipeline Energy Network (OPEN) project, designed to transport natural gas from the Marcellus and Utica shale plays to points in the Midwest, Southeast, and the Gulf Coast, was cleared by the Federal Energy Regulatory Commission this week. The project will place in service the Berne and the Tompkinsville compressor stations to enable bi-directional flow on the Texas Eastern pipeline and will add up to 0.55 Bcf/d of additional takeaway capacity. OPEN is one of several projects in the Northeast designed to relieve constraints by adding backhaul capacity to move natural gas production from the Northeast to the Southeast/Gulf region in the next few years. So far, the flows through the Tompkinsville compressor, which averaged 0.67 Bcf/d over the past 30 days, have not increased, according to Bentek Energy data.
Nymex prices increase by a penny. At the Nymex, the October contract began the week at $2.651/MMBtu and ended the report week up slightly, at $2.660/MMBtu yesterday amid forecasts of warmer weather and stronger demand than is typical for this time of year. The 12-month strip, which averages the October 2015 through September 2016 Nymex prices, closed at $2.871/MMBtu yesterday, down slightly from the week-ago price of $2.885/MMBtu.
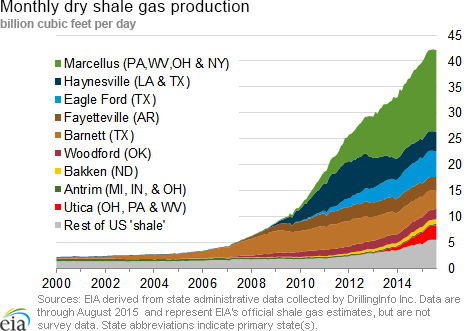
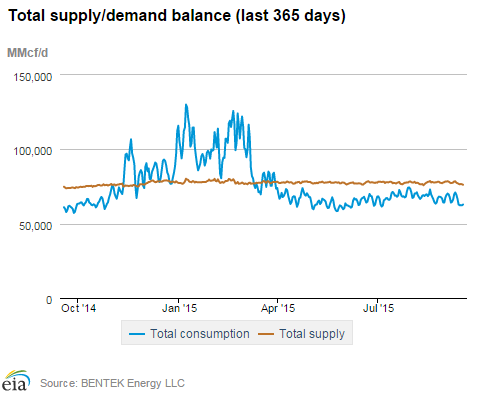
Supply declines slightly. Dry natural gas production declined by 0.8% this week and averaged 71.9 Bcf/d, 2.9% higher than the level for this week in 2014, according to Bentek Energy data. Imports of natural gas from Canada declined by 10%, led by an 8% decrease in imports to the western part of the country, which is likely related to maintenance outages. LNG sendout declined by 12%, averaging 0.3 Bcf/d, and remained a small contributor to supply. Overall, supply decreased by 1.4% week-over-week.
Consumption decreases. U.S. consumption decreased by 5% overall, compared to the last report week, led by a 15% decline in natural gas used for power generation. The largest week-over-week percent decrease in power burn was in the Midwest, where consumption declined by 53%, followed by declines in the Midcontinent (45%), Texas (15%), and the Southeast (13%). Consumption in the residential/commercial and industrial sectors increased by 11% and 1%, respectively. Exports to Mexico averaged 3.0 Bcf/d, a 1% decrease from the previous week, and 35% higher than exports for the same week last year.
Storage
Net storage injection is smaller than both the five-year average and last year's builds for the report week. The net injection reported for the week ending September 11 was 73 billion cubic feet (Bcf), up from 68 Bcf the previous week. This injection compares with the five-year average increase of 75 Bcf for the week and last year's increase of 90 Bcf. Working gas inventories for the report week totaled 3,334 Bcf, 456 Bcf (16%) higher than last year at this time and 125 Bcf (4%) higher than the five-year (2010-14) average.
Storage injections match market expectations. Market expectations, on average, called for a build of 73 Bcf for this week. When the EIA storage report was released at 10:30 a.m. on September 17, the price for the October natural gas futures contract increased a few cents to about $2.65/MMBtu, and in the minutes thereafter, returned to its pre-release price. In the next hour, the price oscillated between $2.65 and $2.67/MMBtu.
From April 3 (the beginning of the injection season) through September 11, net storage injections totaled 1,873 Bcf, or 172 Bcf lower than the 2,045 Bcf injected during the same 24 weeks in 2014. During these weeks for the years 2010-14, net injections into storage averaged 1,558 Bcf. The estimated average unit value of the natural gas put into storage from April 3 to September 11 this year is $2.76/MMBtu, 36% lower than the average value of $4.33/MMBtu for the same 24 weeks last year. The highest winter-month Nymex price (for the January 2016 contract) in trading for the week ending September 11 averaged $3.02/MMBtu. This price is 34¢/MMBtu more than the October Nymex contract price. A year ago, the difference was 36¢/MMBtu.
Temperatures during the storage report week are warmer than normal. Temperatures in the Lower 48 states averaged 76° for the storage report week, 6° warmer than the 30-year normal temperature and 3° warmer than the average temperature during the same week last year. There were 77 population-weighted cooling degree days (CDD) this report week, 22 CDD more than the five-year average and 18 CDD more than during this week last year.
See also:
| Spot Prices ($/MMBtu) | Thu, 10-Sep |
Fri, 11-Sep |
Mon, 14-Sep |
Tue, 15-Sep |
Wed, 16-Sep |
|---|---|---|---|---|---|
| Henry Hub |
2.71 |
2.66 |
2.70 |
2.73 |
2.68 |
| New York |
2.40 |
1.72 |
2.08 |
2.55 |
2.66 |
| Chicago |
2.71 |
2.68 |
2.75 |
2.78 |
2.70 |
| Cal. Comp. Avg,* |
2.88 |
2.83 |
2.87 |
2.89 |
2.85 |
| Futures ($/MMBtu) | |||||
| October contract |
2.683 |
2.693 |
2.758 |
2.728 |
2.660 |
| November contract |
2.759 |
2.767 |
2.828 |
2.800 |
2.739 |
| *Avg. of NGI's reported prices for: Malin, PG&E citygate, and Southern California Border Avg. | |||||
| Source: NGI's Daily Gas Price Index | |||||
| U.S. natural gas supply - Gas Week: (9/9/15 - 9/16/15) | ||
|---|---|---|
Percent change for week compared with: |
||
last year |
last week |
|
| Gross production | 2.95%
|
-0.78%
|
| Dry production | 2.93%
|
-0.77%
|
| Canadian imports | 1.03%
|
-9.92%
|
| West (net) | 14.50%
|
-8.37%
|
| Midwest (net) | -14.21%
|
-0.70%
|
| Northeast (net) | -16.23%
|
-3205.66%
|
| LNG imports | 282.48%
|
-12.16%
|
| Total supply | 3.07%
|
-1.42%
|
| Source: BENTEK Energy LLC | ||
| U.S. consumption - Gas Week: (9/9/15 - 9/16/15) | ||
|---|---|---|
Percent change for week compared with: |
||
last year |
last week |
|
| U.S. consumption | 0.5%
|
-5.3%
|
| Power | 11.8%
|
-15.0%
|
| Industrial | -3.5%
|
1.2%
|
| Residential/commercial | -12.9%
|
11.2%
|
| Total demand | 1.7%
|
-5.1%
|
| Source: BENTEK Energy LLC | ||
| Rigs | |||
|---|---|---|---|
Fri, September 11, 2015 |
Change from |
||
last week |
last year |
||
| Oil rigs | 652 |
-1.51% |
-59.05% |
| Natural gas rigs | 196 |
-2.97% |
-42.01% |
| Miscellaneous | 0 |
0.00% |
-100.00% |
| Rig numbers by type | |||
|---|---|---|---|
Fri, September 11, 2015 |
Change from |
||
last week |
last year |
||
| Vertical | 119 |
-0.83% |
-68.01% |
| Horizontal | 648 |
-1.67% |
-51.71% |
| Directional | 81 |
-4.71% |
-62.67% |
| Source: Baker Hughes Inc. | |||
| Working gas in underground storage | ||||
|---|---|---|---|---|
Stocks billion cubic feet (bcf) |
||||
| Region | 2015-09-11 |
2015-09-04 |
change |
|
| East | 1,680 |
1,630 |
50 |
|
| West | 489 |
487 |
2 |
|
| Producing | 1,165 |
1,144 |
21 |
|
| Total | 3,334 |
3,261 |
73 |
|
| Source: U.S. Energy Information Administration | ||||
| Working gas in underground storage | |||||
|---|---|---|---|---|---|
Historical comparisons |
|||||
Year ago (9/11/14) |
5-year average (2010-2014) |
||||
| Region | Stocks (Bcf) |
% change |
Stocks (Bcf) |
% change |
|
| East | 1,572 |
6.9 |
1,718 |
-2.2 |
|
| West | 444 |
10.1 |
476 |
2.7 |
|
| Producing | 862 |
35.2 |
1,016 |
14.7 |
|
| Total | 2,878 |
15.8 |
3,209 |
3.9 |
|
| Source: U.S. Energy Information Administration | |||||
| Temperature -- heating & cooling degree days (week ending Sep 10) | ||||||||
|---|---|---|---|---|---|---|---|---|
HDD deviation from: |
CDD deviation from: |
|||||||
| Region | HDD Current |
normal |
last year |
CDD Current |
normal |
last year |
||
| New England | 2
|
-14
|
-9
|
48
|
39
|
22
|
||
| Middle Atlantic | 0
|
-9
|
-3
|
65
|
44
|
32
|
||
| E N Central | 2
|
-13
|
-8
|
69
|
48
|
38
|
||
| W N Central | 6
|
-15
|
-13
|
73
|
43
|
41
|
||
| South Atlantic | 0
|
-1
|
0
|
95
|
24
|
9
|
||
| E S Central | 0
|
-1
|
0
|
94
|
32
|
6
|
||
| W S Central | 0
|
-1
|
0
|
126
|
30
|
10
|
||
| Mountain | 10
|
-14
|
-4
|
52
|
4
|
2
|
||
| Pacific | 6
|
-2
|
4
|
53
|
18
|
1
|
||
| United States | 3
|
-8
|
-3
|
77
|
32
|
18
|
||
|
Note: HDD = heating degree-day; CDD = cooling degree-day Source: National Oceanic and Atmospheric Administration | ||||||||
Average temperature (°F)
7-Day Mean ending Sep 10, 2015
Source: NOAA/National Weather Service
Deviation between average and normal (°F)
7-Day Mean ending Sep 10, 2015
Source: NOAA/National Weather Service