In the News:
Natural gas challenges coal as fuel for power generation
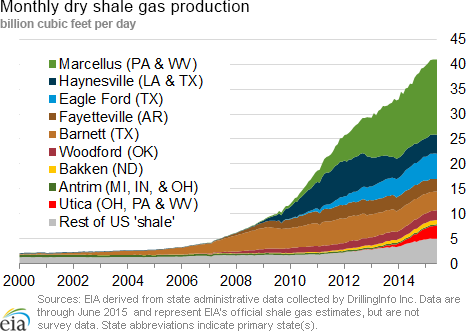
Consumption of natural gas for power generation (power burn) so far in 2015 has been about 1% higher than last year over the same period, partly because of low natural gas prices and retirements of coal-fired power plants. Year to date, power burn has averaged 24.6 billion cubic feet per day (Bcf/d), compared to 24.4 Bcf/d for the same period in 2012, which holds the record for most power burn in a single year. In particular, power burn has been high this year in the eastern half of the country.
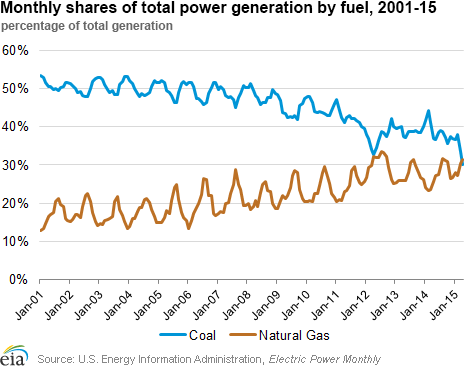
In April, natural gas-fired generation surpassed coal-fired generation as a percentage of total generation. Gas-fired generation made up 32% of total generation compared with 30% for coal-fired generation. Although the contribution from coal- and gas-fired generation converged in April 2012, when gas prices hit an all-time monthly low, April 2015 marks the first month gas-fired generation actually exceeded coal-fired generation in the same month. Because of low demand from mild spring weather, generation from both coal and natural gas, as well as total generation, generally hit their annual lows in April.
While natural gas-fired generation has been rising over the past several years because of relatively low prices and new capacity coming online, coal-fired generation has been declining as older plants have been retired. About 4 GW of coal-fired capacity retired in April, although on average this capacity was operating at a below-normal 25% capacity factor, meaning generally that these coal-fired plants ran only 25% of the time By comparison, a typical baseload plant might have capacity factors in the 90% range.
This year, retirements accelerated as the Environmental Protection Agency's (EPA) Mercury and Air Toxics Standards (MATS) rules were implemented. MATS requires large coal- and oil-fired electric generators to meet stricter emissions standards by incorporating emissions control technologies in existing generating facilities. Some power plant operators decided that retrofitting units to meet the new standards would be cost-prohibitive and chose instead to retire some units. MATS currently remains in effect, but is under evaluation in the D.C. Circuit Court of Appeals, following a June 29 decision from the U.S. Supreme Court.
In 2012, the primary reason natural gas and coal were equal in their share of total generation was because natural gas prices had dropped to very low levels — in April 2012, natural gas prices averaged $1.95 per million British thermal unit (MMBtu), following a warm winter and production increases. The electric power sector absorbed excess supply, and continued to do so throughout the summer, and 2012 was a record high year for natural gas generation.
While prices this year remain sufficiently low to encourage coal displacement, averaging $2.61/MMBtu, the additional effect of retirements has led to more gas-fired generation. On an annual basis, coal-fired generation remains much greater than natural-gas fired generation as a share of the total, and EIA's Annual Energy Outlook expects coal will retain a greater share of generation through 2040, though the gap between the two fuels will narrow through the projection period. Natural gas is projected to make up 31% of all generation and coal is expected to make up 34% in 2040.
Overview:
(For the Week Ending Wednesday, July 15, 2015)
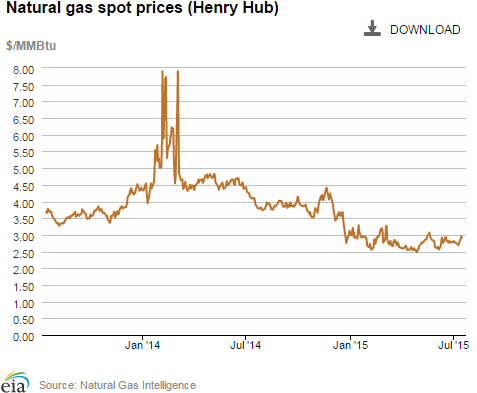
- Natural gas prices increased at most market locations through the report week (Wednesday, July 8, through Wednesday, July 15). The Henry Hub spot price began the week at $2.71/MMBtu last Wednesday and ended the report week up, closing at $2.92/MMBtu.
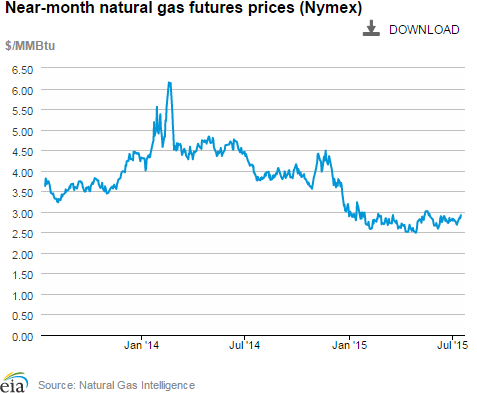
- At the New York Mercantile Exchange (Nymex), the August contract began the week at $2.685/MMBtu last Wednesday and increased by 23¢ to settle at $2.918/MMBtu yesterday.
- Working natural gas in storage increased to 2,767 Bcf as of Friday, July 10. A net injection into storage of 99 Bcf for the week resulted in storage levels 31% above a year ago and 3% above the five-year average for this week.
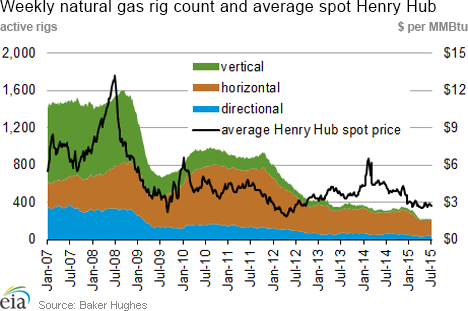
- The total oil and natural gas rig count increased by 1 unit to 863 for the week ending Friday, July 10, according to data from Baker Hughes Incorporated. The oil rig count increased by 5 units, totaling 645, while the natural gas rig count decreased by 2 to 217. Miscellaneous rigs also decreased by 2 units down to 1. Though this is the third consecutive week that the total rig count increased, rig activity was mixed, with the Permian Basin in West Texas adding the most oil rigs, 7, while other plays, such as Eagle Ford in South Texas and Marcellus in the Northeast, had rig counts that were down.
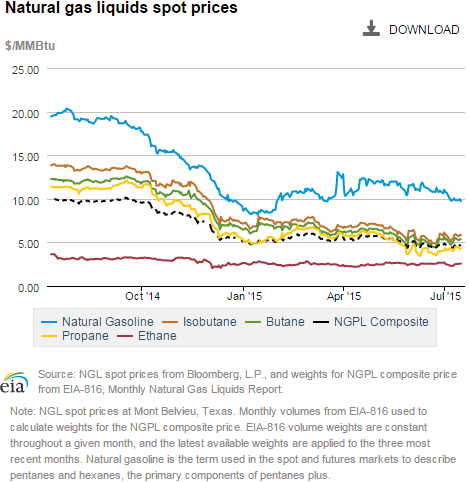
- The natural gas plant liquids composite price at Mont Belvieu, Texas, decreased by 24¢ to $4.51/MMBtu for the week ending July 10, a 5.1% drop. While the price for propane was up for the week by 1.6% (6¢), prices for natural gasoline, ethane, butane, and isobutane decreased by 8.5% (92¢), 8.4% (22¢), 6.4% (35¢), and 6.7% (40¢), respectively, from the previous week.
Prices/Demand/Supply:
Natural gas prices increase at most locations. Driven by mixed temperatures and maintenance outages, prices rose modestly over the report week. Most market locations east of the Rockies stayed below the Henry Hub, which opened the report week at $2.71/MMBtu and closed at $2.92/MMBtu yesterday. In the West, cooler weekend weather lowered prices at most trading locations, though both temperatures and spot prices rose into the second half of the week closing higher. Maintenance driven constraints on Canadian imports and above-average power sector consumption applied upward pressure during the report week to prices in the Pacific Northwest, despite lower temperatures. The Kingsgate price, at the Idaho border, for imported Canadian natural gas from TransCanada rose from $2.34 /MMBtu on July 8 to $2.86/MMBtu yesterday. And Sumas in Washington opened at $2.20/MMBtu on Wednesday, July 8, to close at $2.35/MMBtu yesterday. Other West Coast trading locations followed a similar pattern, with Malin in southern Oregon rising 31¢ over the report week to close at $2.93/MMBtu yesterday, and PG&E Citygate serving Northern California climbing 14¢ to end the report week at $3.25/MMBtu.
Northeast prices mixed in response to mixed temperatures. After starting the week with cool temperatures and near-record low prices, some Northeast prices rose to close up by 25% or more. At Algonquin Citygate, serving Boston, prices started the week at $1.35/MMBtu last Wednesday, rose to more than $2 by Friday, and then settled at $1.98/MMBtu yesterday with slightly above average temperatures. Tennessee Zone 6 200L, supplying lower New England, generally paralleled Algonquin and rose through the week to close at $2.16/MMBtu yesterday. Transco Zone 6 New York, serving New York City began the week at $2.27/MMBtu, rose Monday to $2.80/MMBtu on warmer temperatures, but then settled down with milder weather at $1.59/MMBtu yesterday.
Marcellus-area prices remain low. Marcellus-area prices also increased over the report week, but remain low. Prices at Tennessee Zone 4 Marcellus started the week at 98¢/MMBtu last Wednesday, bumped up slightly on Friday to $1.02/MMBtu, where it stayed through Tuesday, and closed the week at 99¢/MMBtu yesterday. On the Transcontinental Leidy Line, prices began at $1.05/MMBtu last Wednesday and rose to finish the report week at $1.14/MMBtu yesterday. Dominion South opened the report week at $1.06/MMBtu on July 8, rose to $1.24 mid-report week, then settled at $1.15/MMBtu yesterday.
Nymex prices increase. The August Nymex contract began the week at $2.685/MMBtu last Wednesday and settled at $2.918/MMBtu yesterday, an increase of 23¢. The near-month Nymex price is 30% less than it was on July 16, 2014, when it closed at $4.119/MMBtu. The 12-month strip (the average of the August 2015 through July 2016 futures contracts) increased from $2.961/MMBtu last Wednesday to end the report week at $3.104/MMBtu yesterday.
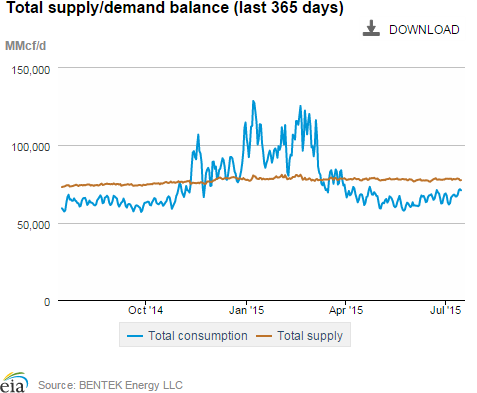
Supply decreases slightly. Dry natural gas production averaged 72.3 Bcf/d, a week-over-week decrease of 0.2%, according to data from Bentek Energy. Despite this decrease, production is 5.3% higher than the same period last year. Net imports of natural gas from Canada were down 1.3% week-over-week, with the Northeast continuing net exports to eastern Canada. LNG sendout was up 0.7% for the week, but remains a minor contributor to supply.
Demand increases, driven by power-sector consumption. U.S. natural gas consumption was up by 6.4% this week, led by increased consumption in the power sector, which increased 12.3%. On Tuesday, power burn reached 35.6 Bcf/d, a new high for 2015, according to Bentek Energy. The increased power burn levels for the report week were driven by increases in the Midwest and Southeast, with increased consumption of 65.9% and 25%, respectively. Consumption was down 0.4% in the industrial sector, but increased by 2.2% in the residential/commercial sector. Exports to Mexico decreased by 0.9% week over week, but were 42% above 2014 levels.
Storage
Net storage injection is higher than five-year average, but lower than last year's build. The net injection reported for the week ending July 10 was 99 Bcf, up from 91 Bcf the previous week. This compares with the five-year average increase of 71 Bcf for the week and last year's increase of 105 Bcf. Working gas inventories for the storage week totaled 2,767 Bcf, 653 Bcf (31%) higher than last year at this time and 73 Bcf (3%) higher than the five-year (2010-14) average.
Storage injections are larger than market expectations. Market expectations, on average, called for a build of 95 Bcf. When the EIA storage report was released at 10:30 a.m. on July 16, the price for the August natural gas futures contract fell 3¢ to about $2.89/MMBtu in Nymex futures trading. In the next hour, the price oscillated between $2.86 and $2.91/MMBtu.
From the week ending April 3 (the beginning of the injection season) through the week ending July 10, net storage injections totaled 1,306 Bcf, or 2% more than the 1,281 Bcf injected during the same 15 weeks in 2014. During these weeks for the years 2010-14, net injections into storage averaged 1,043 Bcf. The estimated average unit value of the natural gas storage holders put into storage from April 3 to July 10 this year is $2.75/MMBtu, 40% lower than the average value of $4.56/MMBtu for the same 15 weeks last year. The highest winter-month Nymex price (for the January 2016 contract) in trading for the week ending July 10 averaged $3.19/MMBtu. This price is 46¢/MMBtu more than the July Nymex contract price. A year ago, the difference was 16¢/MMBtu, suggesting there is more financial incentive this year to buy and store natural gas in the summer for sale in the winter.
Temperatures during the storage report week were cooler than normal. Temperatures in the Lower 48 states averaged 74° Fahrenheit for the storage report week, 1° cooler than the 30-year normal temperature and 1° cooler than the average temperature during the same week last year. There were 66 population-weighted cooling degree days (CDD) this report week, 18 CDD fewer than the five-year average and 5 CDD fewer than during this week last year.
See also:
| Spot Prices ($/MMBtu) | Thu, 09-Jul |
Fri, 10-Jul |
Mon, 13-Jul |
Tue, 14-Jul |
Wed, 15-Jul |
|---|---|---|---|---|---|
| Henry Hub |
2.69 |
2.75 |
2.88 |
2.95 |
2.92 |
| New York |
1.96 |
1.86 |
2.80 |
1.94 |
1.59 |
| Chicago |
2.67 |
2.74 |
2.90 |
2.96 |
2.91 |
| Cal. Comp. Avg,* |
2.71 |
2.75 |
3.00 |
3.09 |
3.07 |
| Futures ($/MMBtu) | |||||
| August contract |
2.726 |
2.770 |
2.864 |
2.840 |
2.918 |
| September contract |
2.738 |
2.780 |
2.867 |
2.839 |
2.909 |
| *Avg. of NGI's reported prices for: Malin, PG&E citygate, and Southern California Border Avg. | |||||
| Source: NGI's Daily Gas Price Index | |||||
| U.S. natural gas supply - Gas Week: (7/8/15 - 7/15/15) | ||
|---|---|---|
Percent change for week compared with: |
||
last year |
last week |
|
| Gross production | 5.38%
|
-0.21%
|
| Dry production | 5.33%
|
-0.20%
|
| Canadian imports | 15.30%
|
-1.30%
|
| West (net) | 23.98%
|
-4.79%
|
| Midwest (net) | 12.26%
|
-1.62%
|
| Northeast (net) | NA |
-47.83%
|
| LNG imports | 50.04%
|
0.72%
|
| Total supply | 6.08%
|
-0.28%
|
| Source: BENTEK Energy LLC | ||
| U.S. consumption - Gas Week: (7/8/15 - 7/15/15) | ||
|---|---|---|
Percent change for week compared with: |
||
last year |
last week |
|
| U.S. consumption | 8.5%
|
6.4%
|
| Power | 21.4%
|
12.3%
|
| Industrial | -3.6%
|
-0.4%
|
| Residential/commercial | -0.9%
|
2.2%
|
| Total demand | 9.8%
|
6.0%
|
| Source: BENTEK Energy LLC | ||
| Rigs | |||
|---|---|---|---|
Fri, July 10, 2015 |
Change from |
||
last week |
last year |
||
| Oil rigs | 645 |
0.78% |
-58.73% |
| Natural gas rigs | 217 |
-0.91% |
-30.23% |
| Miscellaneous | 1 |
-66.67% |
0.00% |
| Rig numbers by type | |||
|---|---|---|---|
Fri, July 10, 2015 |
Change from |
||
last week |
last year |
||
| Vertical | 121 |
12.04% |
-67.90% |
| Horizontal | 654 |
-0.46% |
-48.75% |
| Directional | 88 |
-9.28% |
-60.36% |
| Source: Baker Hughes Inc. | |||
| Working gas in underground storage | ||||
|---|---|---|---|---|
Stocks billion cubic feet (bcf) |
||||
| Region | 2015-07-10 |
2015-07-03 |
change |
|
| East | 1,235 |
1,178 |
57 |
|
| West | 450 |
440 |
10 |
|
| Producing | 1,082 |
1,050 |
32 |
|
| Total | 2,767 |
2,668 |
99 |
|
| Source: U.S. Energy Information Administration | ||||
| Working gas in underground storage | |||||
|---|---|---|---|---|---|
Historical comparisons |
|||||
Year ago (7/10/14) |
5-year average (2010-2014) |
||||
| Region | Stocks (Bcf) |
% change |
Stocks (Bcf) |
% change |
|
| East | 1,035 |
19.3 |
1,300 |
-5.0 |
|
| West | 356 |
26.4 |
426 |
5.6 |
|
| Producing | 723 |
49.7 |
967 |
11.9 |
|
| Total | 2,114 |
30.9 |
2,694 |
2.7 |
|
| Source: U.S. Energy Information Administration | |||||
| Temperature -- heating & cooling degree days (week ending Jul 09) | ||||||||
|---|---|---|---|---|---|---|---|---|
HDD deviation from: |
CDD deviation from: |
|||||||
| Region | HDD Current |
normal |
last year |
CDD Current |
normal |
last year |
||
| New England | 3
|
2
|
2
|
34
|
-1
|
-22
|
||
| Middle Atlantic | 2
|
1
|
0
|
53
|
2
|
-8
|
||
| E N Central | 11
|
10
|
2
|
29
|
-23
|
-7
|
||
| W N Central | 9
|
5
|
3
|
41
|
-25
|
-9
|
||
| South Atlantic | 0
|
0
|
0
|
97
|
3
|
3
|
||
| E S Central | 0
|
0
|
-1
|
85
|
-5
|
17
|
||
| W S Central | 0
|
0
|
0
|
117
|
-3
|
6
|
||
| Mountain | 4
|
-3
|
4
|
75
|
2
|
-16
|
||
| Pacific | 0
|
-5
|
0
|
52
|
14
|
-16
|
||
| United States | 4
|
2
|
1
|
66
|
-3
|
-5
|
||
|
Note: HDD = heating degree-day; CDD = cooling degree-day Source: National Oceanic and Atmospheric Administration | ||||||||
Average temperature (°F)
7-Day Mean ending Jul 09, 2015
Source: NOAA/National Weather Service
Deviation between average and normal (°F)
7-Day Mean ending Jul 09, 2015
Source: NOAA/National Weather Service