In the News:
U.S. natural gas exports to Mexico in June set for record high levels
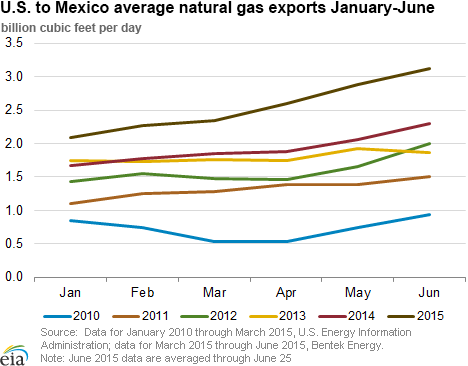
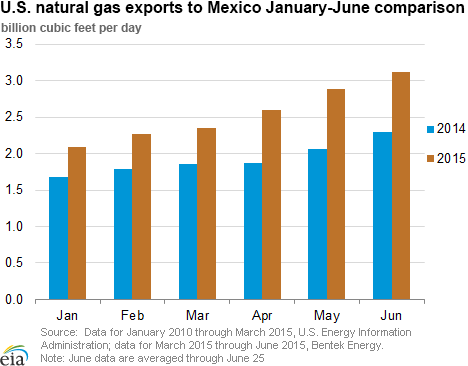
U.S. natural gas exports to Mexico reached a record-high 3.5 billion cubic feet (Bcf) on June 18, according to data from Bentek Energy. Exports have been trending up since 2010, and are 33% higher year-to-date over 2014 levels.
From 2010 to 2014, U.S. natural gas exports to Mexico doubled in response to declining Mexican production, increasing Mexican demand for natural gas, and rising U.S. production. Mexico's energy ministry, the Secretaria de Energia (Sener) projects imports to continue increasing, reaching an annual average of 3.8 Bcf/d by 2018. The recent increase in U.S. exports to Mexico may be influenced by hotter temperatures heading into the summer season, as Mexico's natural gas imports typically peak in the summer on increased demand from the power sector. Additionally, the two most recent pipeline additions, Net Mexico pipeline in Texas and the Sierrita Pipeline in Arizona, which came online in late 2014, have ramped up delivered volumes as their connecting pipelines in Mexico have come online, allowing each to move toward full capacity.
Cross border export capacity from the United States expanded in 2014 by 2.5 Bcf/d to approximately 7 Bcf/d, and is on track to expand again with several planned pipeline projects. In February 2015, Mexico's state utility Comisión Federal de Electricidad (CFE) awarded contracts for construction and operation of the Waha-Presidio and Waha-San Elizario pipelines, with capacity totaling 2.7 Bcf/d, to flow increased volumes of natural gas from Texas to Mexico.
There are additional pipelines that are planned, but not currently under construction. Among these is an Impulsora Pipeline LLC project, which has received conditional authorization from the U.S. Federal Energy Regulatory Commission (FERC) to construct a natural gas pipeline and border crossing. This export project includes both a 12-inch and a 36-inch diameter pipelines with a combined design capacity of 1.12 Bcf/d. Additionally, Trans-Pecos intrastate system has applied to FERC to build a 42-inch diameter pipeline and related facilities in Texas near Presidio. It would transport gas from the Waha Hub in Pecos County to the border, and have a capacity of 1.3 Bcf/d. These projects are planned to enter service in early-to-mid-2017.
Mexico's increasing demand for natural gas is driven primarily by the power generation sector, with its commitment to reduce the use of fuel oil for the generation of electricity, followed by the industrial sector. Though the increased capacity of these new cross-border export projects may outpace the initial demand from Mexico, the expansion of the national pipeline system in Mexico will open access to new regions and industries.
Overview:
(For the Week Ending Wednesday, June 24, 2015)
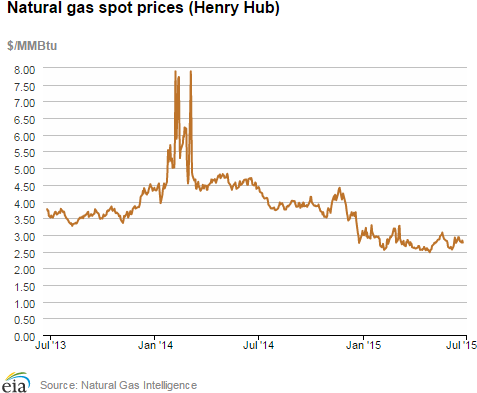
- Prices of natural gas declined in all market locations across the country over the report week (Wednesday, June 17 through Wednesday, June 24), and remained relatively low. The Henry Hub spot price began the week at $2.93 per million British thermal units (MMBtu) last Wednesday and ended the week at $2.77/MMBtu.
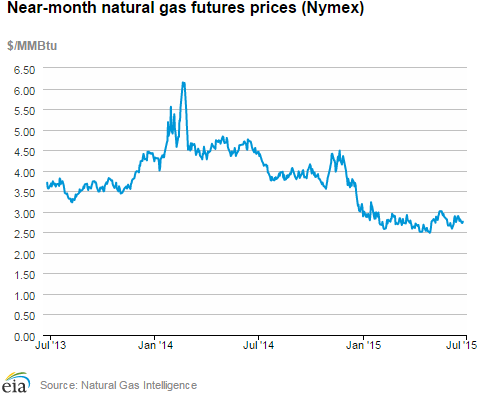
- At the New York Mercantile Exchange (Nymex), the price of the near-month futures contract (July 2015) declined from $2.855/MMBtu last Wednesday to $2.759/MMBtu yesterday.
- Working natural gas in storage increased to 2,508 Bcf as of Friday, June 19. A net injection into storage of 75 Bcf for the week resulted in storage levels 38% above a year ago and 1% above the five-year average for this week.
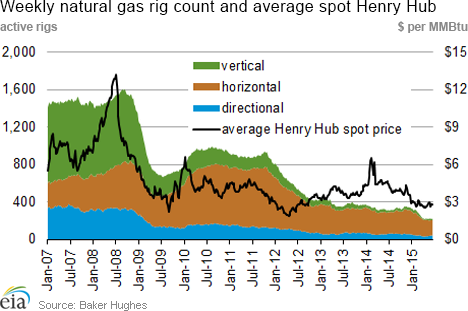
- The total oil and natural gas rig count fell by 2 units to 857 for the week ending Friday, June 19, down 1,001 rigs from the same week in 2014 and the lowest since January 2003, according to data from Baker Hughes Incorporated. This week marked the 28th consecutive week of declines in the rig count since December 12, 2014, with total rigs declining by 55% over this period. The largest decline was in the oil rigs, from 1,546 units on December 12 to 631 units on June 19, a decrease of 59%. Natural gas rig count also declined from 346 units to 223 units (36%) over this period and was 88 units (28%) below the same week last year.
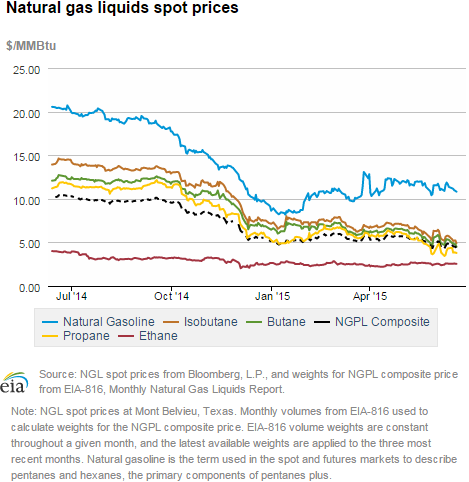
- The natural gas plant liquids composite price at Mont Belvieu declined by 13¢ per MMBtu to $4.54/MMBtu for the week ending June 19, and was 1¢ above the lowest price on record reported for the week ending May 29. Prices of natural gasoline, isobutane, and butane decreased by 4.1% (47¢), 7.6% (43¢), and 7.4% (38¢), respectively, while prices of propane and ethane remained unchanged from the previous week.
Prices/Demand/Supply:
Prices decline in all market locations. Natural gas prices decreased in all market locations last week, despite above-average temperatures across most of the country. The Henry Hub spot price began the report week at $2.93/MMBtu last Wednesday and settled yesterday at $2.77/MMBtu. Prices at other market locations also declined, with the largest declines in the Northeast. Prices at PG&E Citygate, serving Northern California, declined by 3% from $3.23/MMBtu last Wednesday to $3.13/MMBtu yesterday. Prices at the Chicago Citygate decreased by 5% Wednesday-to-Wednesday, closing yesterday at $2.75/MMBtu.
Northeast prices decline. In the Northeast, prices and consumption in the electric power sector fluctuated during the report week in response to varying temperatures and maintenance outages. Gas prices at the Algonquin Citygate, which serves Boston, started the report week at $2.04/MMBtu amid above-average temperatures, declined by 51¢ by Friday, rebounded to $2.51/MMBtu on Monday as temperatures increased again and settled at $1.51/MMBtu yesterday as the heat receded. Prices at the Algonquin Citygate remain historically low, slightly above an all-time record low level of $1.30/MMBtu in early June, and are $2.40/MMBtu below the weekly average for the same week last year. Similarly, at Transcontinental Pipeline's Zone 6 trading point for New York City delivery, the spot price started the report week at $2.91/MMBtu, decreased slightly by Friday, rebounded on Monday as hotter temperatures returned and settled yesterday at $2.54/MMBtu. Prices at the Tennessee Zone 6 200L serving lower New England, also fluctuated during the report week, starting last Wednesday at $2.06/MMBtu and settling yesterday at $1.65/MMBtu. Multiple maintenance-related outages may have contributed to price fluctuations in the Northeast.
Marcellus prices decline. Already-low Marcellus-area prices declined in all trading locations through the week. At Tennessee’s Zone 4 Marcellus location, prices decreased from $1.22/MMBtu last Wednesday to $1.12/MMBtu yesterday. At Dominion South, which serves customers in portions of Pennsylvania, Ohio, Maryland, West Virginia, and Virginia, prices decreased by 22%, from $1.62/MMBtu to $1.27/MMBtu. On the Transco Leidy Line, prices declined by 41¢, from $1.62/MMBtu last Wednesday to $1.21/MMBtu yesterday.
Nymex prices decline. At the Nymex, the July contract began the week at $2.855/MMBtu and fell a dime to close at $2.759/MMBtu yesterday. The 12-month strip, which averages the July 2015 through June 2016 Nymex prices, closed at $3.020/MMBtu yesterday, down 6.6¢/MMBtu from the week-ago price.
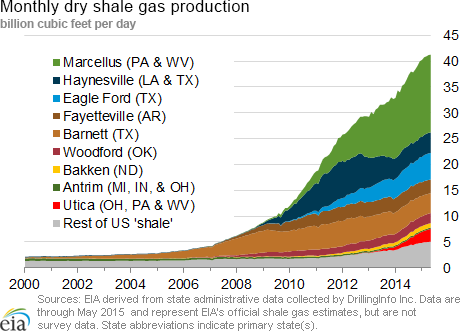
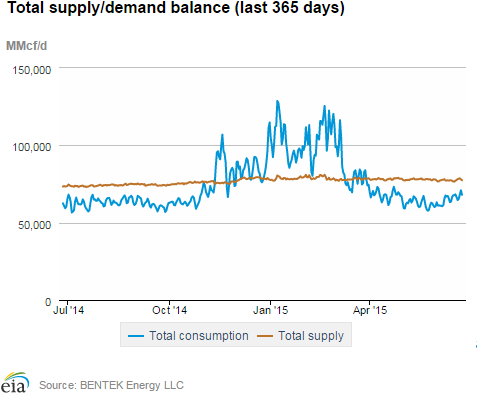
Production increases despite maintenance-related pipeline outages. Dry natural gas production increased this week by 1.0% and averaged 72.2 billion cubic feet per day (Bcf/d), 5.4% higher than last year's levels, according to Bentek Energy data. Imports of natural gas from Canada increased by 2.4%, led by 3.7% increase in imports to the western part of the country. LNG sendout decreased slightly, and remained at minimal levels. Overall, supply increased by 1.1% week over week and averaged 77.9 Bcf/d.
Increase in demand is led by power generation. U.S. gas consumption increased by 2.4% this week, with the largest increase in the power sector, which more than offset declines in residential/commercial and industrial sectors. Consumption of natural gas for power generation (power burn) increased by 6.1% during the report week, 24.2% higher than the same week last year. Power burn reached its highest level this year on Tuesday, increasing to 34.4 Bcf/d. The largest week-over-week percent increases in power burn were in the Midwest, Midcontinent, and the Pacific Northwest. Power burn demand in the Pacific Northwest was at record high level this week, reaching 1.0 Bcf/d, the highest level since February 2014, as hydro generation output in the region remained low. Industrial consumption declined by 1.7%, and residential and commercial consumption also declined slightly, by 0.4%, week over week. Exports to Mexico continued to increase and hit another record on Thursday and Friday last week, reaching 3.5 Bcf/d, according to data from Bentek Energy, and were 39.2% higher than exports for the same week last year.
Storage
With warmer weather, injections into storage moderate. The net injection reported for the week ending June 19 was 75 Bcf, down from 89 Bcf the previous week. This compares with the five-year average increase of 86 Bcf for the week and last year's increase of 110 Bcf. Working gas inventories for the storage week totaled 2,508 Bcf, 695 Bcf (38%) higher than last year at this time and 35 Bcf (1%) higher than the five-year (2010-14) average.
Storage injections were slightly lower than market expectations. Market expectations, on average, called for a build of 77 Bcf. When the EIA storage report was released at 10:30 a.m. on June 25, the price for the July natural gas futures contract fluctuated modestly and eventually stabilized at $2.81/MMBtu in Nymex futures trading, very close to where prices were prior to the release.
From the week ending April 3 (the beginning of the injection season) through the week ending June 19, net storage injections totaled 1,047 Bcf, or 7% more than the 980 Bcf injected during the same 12 weeks in 2014. During these weeks for the years 2010-14, net injection into storage averaged 822 Bcf. The estimated average unit value of the natural gas storage holders put into storage from April 3 to June 19 this year is $2.75/MMBtu, 40% lower than the average value of $4.61/MMBtu for the same 12 weeks last year. The highest winter-month Nymex price (for the January 2016 contract) in trading for the week ending June 19 averaged $3.29/MMBtu. This price is 47¢/MMBtu more than the July Nymex contract price. A year ago, the difference was 12¢/MMBtu, suggesting there is more financial incentive this year to buy and store natural gas in the summer for sale in the winter.
Temperatures during the storage report week warmer than normal. Temperatures in the Lower 48 states averaged 75° Fahrenheit for the storage report week, 4° warmer than the 30-year normal temperature and 3° warmer than the average temperature during the same week last year There were 70 population-weighted cooling degree days (CDD) this report week, 16 CDD more than the five-year average and 18 CDD more than during this week last year.
See also:
| Spot Prices ($/MMBtu) | Thu, 18-Jun |
Fri, 19-Jun |
Mon, 22-Jun |
Tue, 23-Jun |
Wed, 24-Jun |
|---|---|---|---|---|---|
| Henry Hub |
2.86 |
2.81 |
2.77 |
2.83 |
2.77 |
| New York |
2.74 |
2.75 |
3.01 |
2.89 |
2.54 |
| Chicago |
2.82 |
2.74 |
2.73 |
2.81 |
2.75 |
| Cal. Comp. Avg,* |
2.94 |
2.84 |
2.86 |
2.93 |
2.92 |
| Futures ($/MMBtu) | |||||
| July contract |
2.777 |
2.816 |
2.733 |
2.726 |
2.759 |
| August contract |
2.799 |
2.840 |
2.762 |
2.746 |
2.782 |
| *Avg. of NGI's reported prices for: Malin, PG&E citygate, and Southern California Border Avg. | |||||
| Source: NGI's Daily Gas Price Index | |||||
| U.S. natural gas supply - Gas Week: (6/17/15 - 6/24/15) | ||
|---|---|---|
Percent change for week compared with: |
||
last year |
last week |
|
| Gross production | 5.50%
|
1.00%
|
| Dry production | 5.40%
|
1.00%
|
| Canadian imports | 11.00%
|
2.40%
|
| West (net) | 44.30%
|
3.70%
|
| Midwest (net) | 3.00%
|
1.00%
|
| Northeast (net) | -158.50%
|
3.20%
|
| LNG imports | -6.30%
|
-2.00%
|
| Total supply | 5.80%
|
1.10%
|
| Source: BENTEK Energy LLC | ||
| U.S. consumption - Gas Week: (6/17/15 - 6/24/15) | ||
|---|---|---|
Percent change for week compared with: |
||
last year |
last week |
|
| U.S. consumption | 8.5%
|
2.4%
|
| Power | 24.2%
|
6.1%
|
| Industrial | -3.0%
|
-1.7%
|
| Residential/commercial | -5.9%
|
-0.4%
|
| Total demand | 9.6%
|
2.2%
|
| Source: BENTEK Energy LLC | ||
| Rigs | |||
|---|---|---|---|
Fri, June 19, 2015 |
Change from |
||
last week |
last year |
||
| Oil rigs | 631 |
-0.63% |
-59.16% |
| Natural gas rigs | 223 |
0.90% |
-28.30% |
| Miscellaneous | 3 |
0.00% |
50.00% |
| Rig numbers by type | |||
|---|---|---|---|
Fri, June 19, 2015 |
Change from |
||
last week |
last year |
||
| Vertical | 100 |
-0.99% |
-73.68% |
| Horizontal | 662 |
-0.15% |
-47.04% |
| Directional | 95 |
0.00% |
-58.33% |
| Source: Baker Hughes Inc. | |||
| Working gas in underground storage | ||||
|---|---|---|---|---|
Stocks billion cubic feet (bcf) |
||||
| Region | 2015-06-19 |
2015-06-12 |
change |
|
| East | 1,053 |
1,000 |
53 |
|
| West | 437 |
430 |
7 |
|
| Producing | 1,018 |
1,003 |
15 |
|
| Total | 2,508 |
2,433 |
75 |
|
| Source: U.S. Energy Information Administration | ||||
| Working gas in underground storage | |||||
|---|---|---|---|---|---|
Historical comparisons |
|||||
Year ago (6/19/14) |
5-year average (2010-2014) |
||||
| Region | Stocks (Bcf) |
% change |
Stocks (Bcf) |
% change |
|
| East | 848 |
24.2 |
1,156 |
-8.9 |
|
| West | 313 |
39.6 |
392 |
11.5 |
|
| Producing | 652 |
56.1 |
925 |
10.1 |
|
| Total | 1,813 |
38.3 |
2,473 |
1.4 |
|
| Source: U.S. Energy Information Administration | |||||
| Temperature -- heating & cooling degree days (week ending Jun 18) | ||||||||
|---|---|---|---|---|---|---|---|---|
HDD deviation from: |
CDD deviation from: |
|||||||
| Region | HDD Current |
normal |
last year |
CDD Current |
normal |
last year |
||
| New England | 12
|
-1
|
1
|
19
|
6
|
3
|
||
| Middle Atlantic | 1
|
-8
|
-3
|
51
|
25
|
17
|
||
| E N Central | 4
|
-6
|
-6
|
48
|
14
|
8
|
||
| W N Central | 8
|
-2
|
-5
|
45
|
0
|
5
|
||
| South Atlantic | 0
|
-1
|
0
|
115
|
40
|
30
|
||
| E S Central | 0
|
0
|
0
|
105
|
36
|
31
|
||
| W S Central | 0
|
0
|
0
|
105
|
4
|
-4
|
||
| Mountain | 6
|
-15
|
-12
|
69
|
16
|
19
|
||
| Pacific | 2
|
-13
|
-7
|
45
|
23
|
35
|
||
| United States | 3
|
-6
|
-4
|
70
|
21
|
18
|
||
|
Note: HDD = heating degree-day; CDD = cooling degree-day Source: National Oceanic and Atmospheric Administration | ||||||||
Average temperature (°F)
7-Day Mean ending Jun 18, 2015
Source: NOAA/National Weather Service
Deviation between average and normal (°F)
7-Day Mean ending Jun 18, 2015
Source: NOAA/National Weather Service