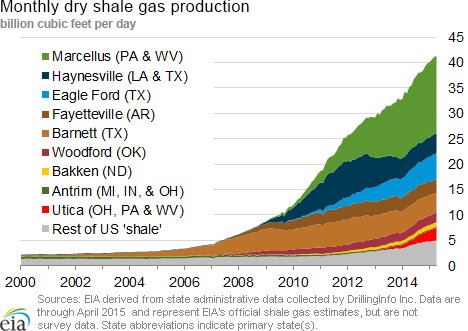
Correction to Natural Gas Production Data for Jan-Mar 2015
The U.S. Energy Information Administration (EIA) reissued the Natural Gas Monthly (NGM) on June 3, 2015 to correct an error in the NGM data originally published on May 29. The error caused marketed and dry natural gas production for the first three months of 2015 to be underreported by about 1.5 billion cubic feet per day (Bcf/d). An adjustment for carbon dioxide produced in the "Other States" category did not properly account for required changes in the gross-to-marketed calculation used in preparation of data from EIA's Form 914 monthly natural gas production survey. Dry gas production for the first quarter of 2015 is now estimated to be approximately 73.5 Bcf/d.
In contrast to EIA's data prior to 2015, gross withdrawals reported for 2015 exclude volumes produced from carbon dioxide wells. For certain states, the May 29 computations to calculate marketed production from gross production double-counted the carbon dioxide removed from gross production, thus resulting in a lower level of marketed and dry natural gas production than should have been reported in Table 1 of the May NGM.
Note: Marketed production is calculated as gross production less nonhydrocarbon gases, vented and flared gas, and reinjected gas.
In the News:
Large weekly addition pushes natural gas stocks above five-year average
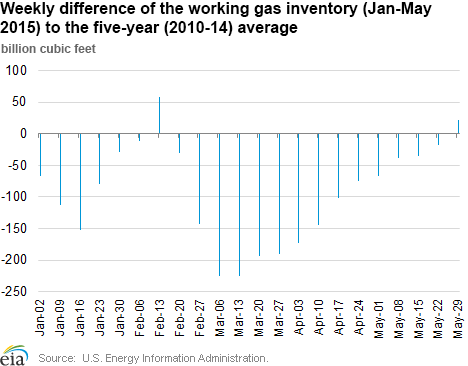
With a net injection of 132 billion cubic feet (Bcf) for the week ending May 29, working natural gas in storage surpassed the five-year (2010-14) average level. This was one of the largest implied weekly net injections ever reported in EIA’s Weekly Natural Gas Storage Report, raising stocks to 2,233 Bcf, 22 Bcf (1%) above the five-year average and 751 Bcf (51%) above this same week last year. Because EIA does not survey storage operators directly on the flows in and out of their facilities, the change in storage levels, week over week, is considered an implied net flow.
Working natural gas inventories at the beginning of the 2015 injection season on April 1 totaled 1,476 Bcf, which was 10.5%, or 173 Bcf, below the five-year average. Inventories in 2014, following a strong 2013-14 winter withdrawal season that led to stocks falling to a 10-year low of 837 Bcf in March, remained below their five-year average throughout 2014.
Earlier this year, on February 13, inventories exceeded the five-year average by 2.8%, or 58 Bcf, because of milder temperatures and reduced demand. With the return of extremely cold weather during the remainder of the winter, however, withdrawals pushed stocks back below their five-year average.
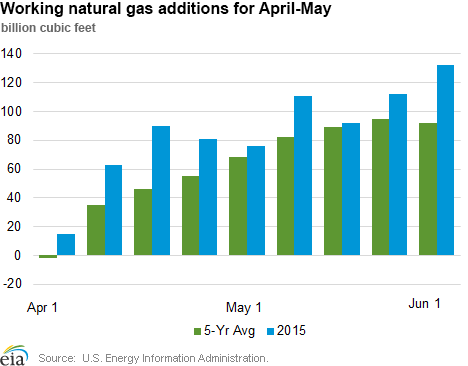
Since the start of this year’s natural gas injection season on April 1, weekly injections surpassed their five-year average each week, and often by a wide margin. Net injections from April 1 through May 29 totaled 772 Bcf, 38% higher than the five-year average of same-period injections. Over this period, there was:
- Increased production averaging 72.8 billion cubic feet per day (Bcf/d), 10.3 Bcf/d (16.5%) above the five-year average of 62.5 Bcf/d, as reported by Bentek Energy.
- Moderate power burn that increased by 3 Bcf/d, or 15%, over the five year average as reported by Bentek, offsetting some of the production gain.
- Moderate weather, during which cooling degree days totaled slightly above the five-year average for April, but below the average for May.
Marketed natural gas production in EIA’s the Short-Term Energy Outlook (STEO), May 2015, is forecasted to be 4.3 Bcf/d (6.0%) higher than the five-year average over the remainder of the 2015 injection season (through October), reflecting production continuing above 2014 levels in the Lower 48 states. This strong natural gas production, along with near-average summer weather forecasted by the National Oceanic and Atmospheric Administration, supports conditions needed for an above-average injection season.
However, even assuming average summer temperatures, EIA is forecasting an annual increase in power burn of 12.9% for 2015 because of moderate prices and the retirement of coal-fired power plants replaced by natural gas generation. If summer temperatures are warmer than the current forecast, that would likely result in greater power burn.
In the May STEO, EIA forecast that end-of-October 2015 inventories will total 3,890 Bcf, 92 Bcf above the five-year average.
Overview:
(For the Week Ending Wednesday, June 3, 2015)
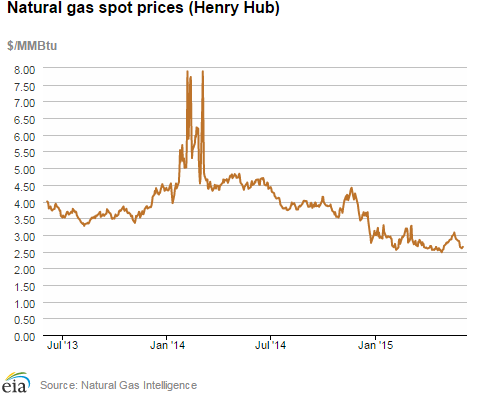
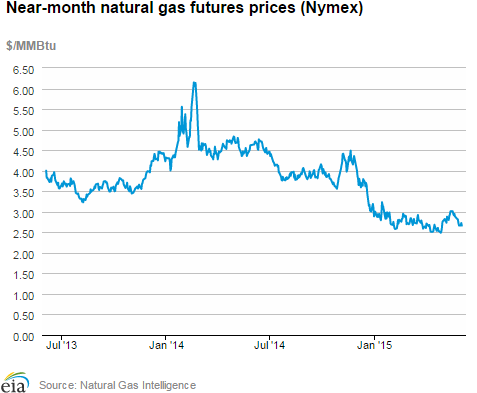
- Prices of natural gas at most market locations declined over the report week (Wednesday, May 27 — Wednesday, June 3), and remained relatively low. The Henry Hub spot price began the week at $2.82 per million British thermal units (MMBtu) last Wednesday and ended the week at $2.64/MMBtu.
- At the New York Mercantile Exchange (Nymex), the June contract expired Wednesday, May 27, at $2.815/MMBtu. The July contract moved into the front-month slot and declined over the week from $2.706/MMBtu last Thursday to $2.634/MMBtu yesterday.
- Working natural gas in storage increased to 2,233 Bcf as of Friday, May 29, according to the U.S. Energy Information Administration (EIA) Weekly Natural Gas Storage Report (WNGSR). A net injection into storage of 132 Bcf for the week resulted in storage 50.7% above a year ago and 1.0% above the five-year average for this week.
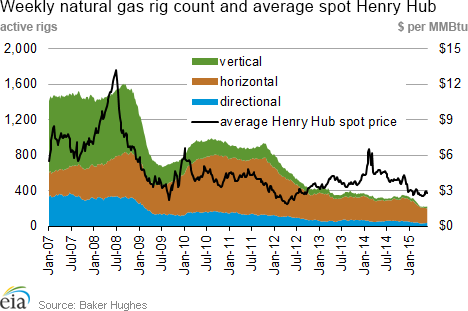
- The total oil and natural gas rig count fell by 10 units to 875 for the week ending Friday, May 29, down 991 rigs from the same week in 2014 and the lowest since January 2003, according to data from Baker Hughes Incorporated. This week marked the 25th week of straight declines since December 12, 2014, with total rigs declining by 53% over this period. Oil rigs led the decline, with a reduction in rig count every week, from 1,546 units on December 12 to 646 units on May 29, a decrease of 58%. Natural gas rigs also declined over this period, falling from 346 units to 225 units (35%). As of May 29, the natural gas rig count increased from the week before by 3 units to 225 units, and was 101 units (31%) below the same week last year.
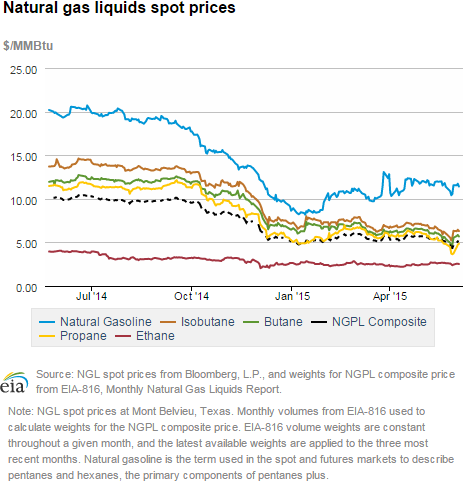
- The natural gas plant liquids composite price at Mont Belvieu declined sharply by 63¢ per MMBtu to $4.53/MMBtu for the week ending May 29, its lowest level since EIA began producing the series in 2009. The largest decline was in the price of propane, which decreased by $1.07/MMBtu (22%) to $3.89/MMBtu. The price of natural gasoline also declined, by 83¢ (7.1%) and ended the week at $10.84/MMBtu. Prices of ethane, butane, and isobutane declined by 6.4%, 10.7%, and 7.5%, respectively.
Prices/Demand/Supply:
Prices decline with mild weather and ample supply. Natural gas prices decreased in all market locations last week, led by mild temperatures across most of the country. The Henry Hub spot price began the week at $2.82/MMBtu and settled yesterday at $2.64/MMBtu. Prices at all locations across the United States declined, with the largest declines in the Northeast. Prices at PG&E citygate declined from $3.19/MMBtu last Wednesday to $2.98/MMBtu yesterday. Prices at the Chicago Citygate decreased by 7% Wednesday-to-Wednesday, closing yesterday at $2.58/MMBtu.
Northeast prices reach historic lows. In the Northeast, prices on Wednesday settled at historically low levels. Prices at the Algonquin Citygate, which serves Boston, started the report week at $2.50/MMBtu, declined by 90¢ by Friday and lost almost half of its value ($1.20) by the end of the report week, settling at $1.30/MMBtu yesterday. This is the all-time lowest price at this trading location since the start of the price series in 1999. Similarly, at Transcontinental Pipeline's Zone 6 trading point for New York City delivery, the spot price started the report week at $2.86/MMBtu, and then declined by 42% ($1.19) to settle at $1.67/MMBtu yesterday. This is slightly higher than its record low of $1.37/MMBtu on October 10, 2014.
Strong production growth in the Northeast, combined with constrained pipeline takeaway capacity and relatively low demand for this time of year have put considerable pressure on natural gas prices in the region. With more than 7.7 gigawatts (GW) of coal capacity scheduled for retirements in the PJM region in 2015, according to SNL Financial, a large share of which will retire in June, the natural gas demand from power generation may pick up some of the lost share of coal generation. Additionally, new pipelines coming online in the Northeast in the next few months will help alleviate existing capacity constraints and move Marcellus gas to other regions.
Marcellus prices decline. Marcellus-area prices steadily declined in all trading locations through the week by 37¢-41¢. At Tennessee’s Zone 4 Marcellus location, prices decreased from $1.35/MMBtu last week to 98¢/MMBtu yesterday. At Dominion South, which serves customers in portions of Pennsylvania, Ohio, Maryland, West Virginia, and Virginia, prices decreased by 24%, from $1.55/MMBtu to $1.18/MMBtu. On the Transco Leidy Line, prices declined by 41¢, from $1.48/MMBtu last week to $1.07/MMBtu yesterday.
Nymex prices decline. At the New York Mercantile Exchange (Nymex), the June contract expired Wednesday, May 27, at $2.815/MMBtu. The July contract moved into the front-month position on Thursday and declined over the week from $2.706/MMBtu last Thursday to $2.634/MMBtu yesterday. The 12-month strip (the average of the 12 contracts between July 2015 and June 2016) declined from $3.026/MMBtu last Wednesday to $2.899/MMBtu yesterday.
Natural gas liquids prices decline sharply. The natural gas plant liquids composite price at Mont Belvieu declined sharply, led by the decline in price of propane, which decreased by $1.07/MMBtu (22%) to $3.89/MMBtu, the lowest level since EIA began producing the series in 2009. Sharp decline in propane prices may be affected by high storage levels, capacity constraints at storage facilities in the Gulf of Mexico, and low demand for liquefied petroleum gas exports.
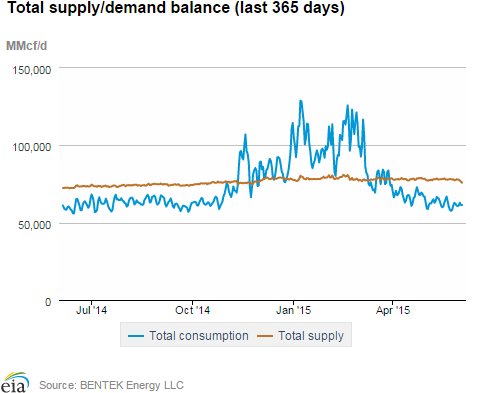
Production declines amid continued maintenance. Dry gas production declined this week by 0.8% and averaged 71.9 Bcf/d, according to Bentek Energy data, but was still 5.3% higher than last year’s levels. Decreased production was attributed primarily to shut-ins at several processing plants and pipeline maintenance. Industry reports indicate the production was not directly affected by intense storms and flooding in Texas, the Gulf Coast, and Midcontinent. Production in the Northeast declined by 0.3 Bcf/d, affected by reduced deliveries at processing plants and maintenance outages. Production also declined in Texas because of outages for maintenance on Tennessee Gas Pipeline and on several Transco receipt points from processing plants along the Gulf Coast. Imports of natural gas from Canada declined by 1.2%, led by the decline in imports to the Midwest, in part because of continued unplanned maintenance on Alliance Pipeline in western Canada. LNG sendout increased slightly, but remains minimal. Overall, supply declined by 0.9% week over week.
Demand increases in power generation. U.S. gas consumption increased by 2.2% this week, with the largest increase in the power sector, which more than offset declines in residential/commercial sectors. Consumption of natural gas for power generation (power burn) increased by 10.2% and averaged 24.1 Bcf/d week over week. The largest increase in power burn was in the Southwest, where demand increased 43% by 1.1 Bcf/d, followed by increases of 0.6 Bcf/d in Texas and 0.4 Bcf/d in the Northeast. Residential and commercial consumption declined 6.7% week over week, while industrial consumption was flat. Exports to Mexico declined by 0.4% from last week, but were still 22% higher than last year’s level.
Storage
Net storage injection is larger than both the five-year average build and last year. The net injection reported for the week ending May 29 was 132 Bcf, up from 112 Bcf the previous week. This compares with the five-year average net increase of 92 Bcf for that week and last year’s net increase of 118 Bcf. Working gas inventories for the storage week totaled 2,233 Bcf, 751 Bcf (50.7%) higher than last year at this time and 22 Bcf (1.0%) higher than the five-year (2010-14) average, the first time storage inventories have exceeded the five-year average since February 13.
Storage injections are larger than market expectations. Market expectations, on average, called for a build of 122 Bcf. When the EIA storage report was released at 10:30 a.m. on June 4, the price for the July natural gas futures contract decreased 4¢ to $2.58/MMBtu in trading on the Nymex. In the next hour, prices oscillated between $2.58 and $2.66.
From the week ending April 3 (the beginning of the injection season) through the week ending May 29, net storage injections totaled 772 Bcf, or 19% more than the 649 Bcf injected during the same nine weeks in 2014. During these weeks for the years 2010 to 2014, net injection into storage averaged 560 Bcf. The estimated average unit value of the natural gas storage holders put into storage from April 3 to May 29 this year was $2.75/MMBtu, 40% lower than the average value of $4.60/MMBtu for the same nine weeks last year. The highest winter-month Nymex price (for the January 2016 contract) in trading for the week ending May 29 averaged $3.26/MMBtu. This price is 45¢/MMBtu more than the July Nymex contract price. A year ago, the difference was 11¢/MMBtu, suggesting there is more financial incentive this year to buy and store natural gas in the summer for sale in the winter.
There are currently 22 more weeks in the injection season, which traditionally runs from April 1 through October 31, although in many years injections continue into November. EIA forecasts that the end-of-October working natural gas inventory level will be 3,890 Bcf, which, as of May 29, would require an average injection of 75 Bcf per week through the end of October. EIA's forecast for the end-of-October inventory level is above the five-year (2010-14) average peak storage value of 3,805 Bcf. To reach the five-year average peak value, average weekly injections through the end of October would need to be 71 Bcf.
East region remains below its five-year average. Net injections for the week in the East were 73 Bcf (20 Bcf larger than its five-year average injection). They were 14 Bcf in the West (1 Bcf smaller than its five-year average), and 45 Bcf in the Producing region (22 Bcf larger than its five-year average). The East region’s inventory is below its five-year average by 115 Bcf (11.6%). In contrast, stock levels in the West and Producing regions are above their five-year averages for the week, by 59 Bcf (16.9%) and 79 Bcf (9.1%), respectively. Storage levels for the East, West, and Producing regions are above their year-ago levels by 234 Bcf, 143 Bcf, and 374 Bcf, respectively.
Temperatures during the storage report week are warmer than normal. Temperatures in the Lower 48 states averaged 66.6° Fahrenheit for the storage report week, 1.4° warmer than the 30-year normal temperature and 1.7° cooler than the average temperature during the same week last year. There were 21 population-weighted heating degree days (HDD) during the storage report week, 2 HDD more than the five-year average and 8 HDD more than during the same period last year. There were also 32 population-weighted cooling degree days (CDD) this report week, 5 CDD fewer than the five-year average and 4 CDD fewer than during this week last year.
See also:
| Spot Prices ($/MMBtu) | Thu, 28-May |
Fri, 29-May |
Mon, 01-Jun |
Tue, 02-Jun |
Wed, 03-Jun |
|---|---|---|---|---|---|
| Henry Hub |
2.77 |
2.64 |
2.60 |
2.62 |
2.64 |
| New York |
2.17 |
2.22 |
2.38 |
1.83 |
1.67 |
| Chicago |
2.67 |
2.59 |
2.60 |
2.58 |
2.58 |
| Cal. Comp. Avg,* |
2.73 |
2.68 |
2.65 |
2.65 |
2.66 |
| Futures ($/MMBtu) | |||||
| June contract |
2.730 |
2.665 |
2.677 |
2.725 |
2.663 |
| July contract |
2.730 |
2.665 |
2.677 |
2.725 |
2.663 |
| *Avg. of NGI's reported prices for: Malin, PG&E citygate, and Southern California Border Avg. | |||||
| Source: NGI's Daily Gas Price Index | |||||
| U.S. natural gas supply - Gas Week: (5/27/15 - 6/3/15) | ||
|---|---|---|
Percent change for week compared with: |
||
last year |
last week |
|
| Gross production | 5.35%
|
-0.85%
|
| Dry production | 5.30%
|
-0.84%
|
| Canadian imports | 7.64%
|
-1.15%
|
| West (net) | 32.55%
|
0.80%
|
| Midwest (net) | -2.91%
|
-1.40%
|
| Northeast (net) | -10626.32%
|
20.77%
|
| LNG imports | 9.60%
|
1.40%
|
| Total supply | 5.46%
|
-0.86%
|
| Source: BENTEK Energy LLC | ||
| U.S. consumption - Gas Week: (5/27/15 - 6/3/15) | ||
|---|---|---|
Percent change for week compared with: |
||
last year |
last week |
|
| U.S. consumption | 1.6%
|
2.2%
|
| Power | 1.1%
|
10.2%
|
| Industrial | 0.5%
|
-0.0%
|
| Residential/commercial | 4.4%
|
-6.7%
|
| Total demand | 2.4%
|
2.1%
|
| Source: BENTEK Energy LLC | ||
| Rigs | |||
|---|---|---|---|
Fri, May 29, 2015 |
Change from |
||
last week |
last year |
||
| Oil rigs | 646 |
-1.97% |
-57.94% |
| Natural gas rigs | 225 |
1.35% |
-30.98% |
| Miscellaneous | 4 |
0.00% |
0.00% |
| Rig numbers by type | |||
|---|---|---|---|
Fri, May 29, 2015 |
Change from |
||
last week |
last year |
||
| Vertical | 111 |
-5.13% |
-72.46% |
| Horizontal | 674 |
-1.32% |
-46.12% |
| Directional | 90 |
5.88% |
-57.55% |
| Source: Baker Hughes Inc. | |||
| Working gas in underground storage | ||||
|---|---|---|---|---|
Stocks billion cubic feet (bcf) |
||||
| Region | 2015-05-29 |
2015-05-22 |
change |
|
| East | 879 |
806 |
73 |
|
| West | 409 |
395 |
14 |
|
| Producing | 945 |
900 |
45 |
|
| Total | 2,233 |
2,101 |
132 |
|
| Source: U.S. Energy Information Administration | ||||
| Working gas in underground storage | |||||
|---|---|---|---|---|---|
Historical comparisons |
|||||
Year ago (5/29/14) |
5-year average (2010-2014) |
||||
| Region | Stocks (Bcf) |
% change |
Stocks (Bcf) |
% change |
|
| East | 645 |
36.3 |
994 |
-11.6 |
|
| West | 266 |
53.8 |
350 |
16.9 |
|
| Producing | 571 |
65.5 |
866 |
9.1 |
|
| Total | 1,482 |
50.7 |
2,211 |
1.0 |
|
| Source: U.S. Energy Information Administration | |||||
| Temperature -- heating & cooling degree days (week ending May 28) | ||||||||
|---|---|---|---|---|---|---|---|---|
HDD deviation from: |
CDD deviation from: |
|||||||
| Region | HDD Current |
normal |
last year |
CDD Current |
normal |
last year |
||
| New England | 46
|
-18
|
-23
|
20
|
17
|
18
|
||
| Middle Atlantic | 28
|
-11
|
2
|
28
|
19
|
16
|
||
| E N Central | 48
|
-18
|
1
|
23
|
6
|
4
|
||
| W N Central | 64
|
-4
|
20
|
17
|
-5
|
-19
|
||
| South Atlantic | 7
|
-3
|
7
|
64
|
14
|
-6
|
||
| E S Central | 8
|
-2
|
9
|
44
|
2
|
-17
|
||
| W S Central | 4
|
3
|
4
|
61
|
-9
|
-10
|
||
| Mountain | 81
|
9
|
31
|
14
|
-15
|
-19
|
||
| Pacific | 49
|
-5
|
16
|
2
|
-9
|
-15
|
||
| United States | 39
|
-7
|
8
|
32
|
3
|
-4
|
||
|
Note: HDD = heating degree-day; CDD = cooling degree-day Source: National Oceanic and Atmospheric Administration | ||||||||
Average temperature (°F)
7-Day Mean ending May 28, 2015
Source: NOAA/National Weather Service
Deviation between average and normal (°F)
7-Day Mean ending May 28, 2015
Source: NOAA/National Weather Service