In the News:
April natural gas consumption for Pacific Northwest power generation is triple the year-ago level
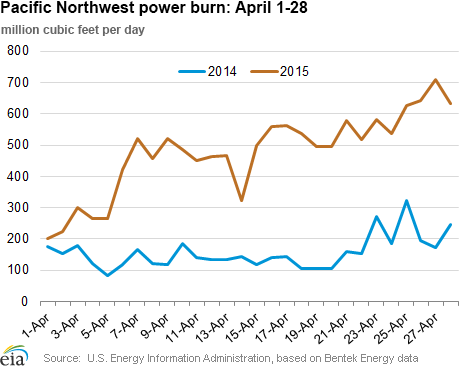
The use of natural gas for power generation (power burn) in April in the Pacific Northwest, which includes Oregon, Washington, and Idaho, is now triple the power burn for the same period in 2014. Power burn reported during the first four weeks of April (1-28) averaged 477 million cubic feet per day (MMcf/d), a 319 MMcf/d year-on-year gain, as reported by Bentek Energy. April 2015 power burn is up by 22% over March levels, whereas power burn in the region typically falls off in April.
Despite this increase, the Pacific Northwest remains one of the lowest power-burn regions in the country, consuming only 2.2% of total power burn volumes. Hydropower supplies more than 62% of the regional electricity needs, with natural gas, coal, nuclear, wind and other renewables contributing to the generation mix. The relatively low level of natural gas prices may be contributing to the higher gas demand this year.
Although drought in the western United States has reduced the level of water available for hydroelectric generation in California, the current water levels in the Pacific Northwest are near average. Snowpack, the accumulation of snow in the upper altitudes found in these states, is shallower than seen for many years, less than 30% of the 30-year average (1981-2010), but spring rain has helped to maintain hydroelectric generation through April. However, reduced hydropower generation is forecast for summer 2015. As a result, natural gas-fired generation may continue to increase to offset reduced generation from hydroelectric and renewables.
Additionally, between now and 2025, natural gas-fired generation may increase because the region's two coal-fired plants are scheduled to retire. These plants, Boardman, with a 550-megawatt (MW) generator in Oregon, and the Centralia Power Plant, with 1,340 MW in Washington (both nameplate capacity), are scheduled to retire during 2020-25. While these two plants contribute 22% of thermal generation capacity (natural gas, coal, and other thermal sources) in the Pacific Northwest, they represent only 4% of total electrical capacity from all sources for the region. Some of this lost generation will be made up with gas-fired generation. EIA data show that 1,934 MW of natural-gas fired capacity is scheduled to come online in the region in 2015-20, which includes the 440-MW, natural gas-fired Carty Generating Station now under construction at Boardman and scheduled to enter service in 2016.
Overview:
(For the Week Ending Wednesday, April 29, 2015)
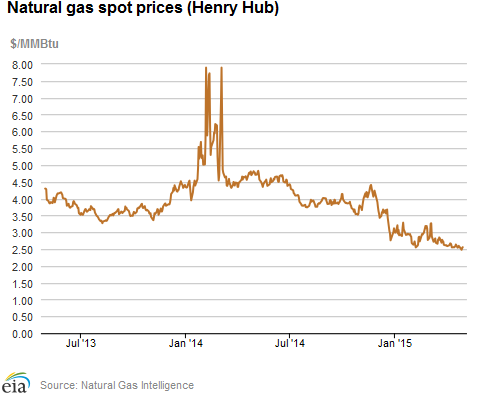
- Natural gas prices fell at most market locations through the report week (Wednesday, April 22 - Wednesday, April 29). Henry Hub spot prices started the week at $2.60 per million British thermal units (MMBtu) last Wednesday, and fell a few cents to $2.56/MMBtu yesterday.
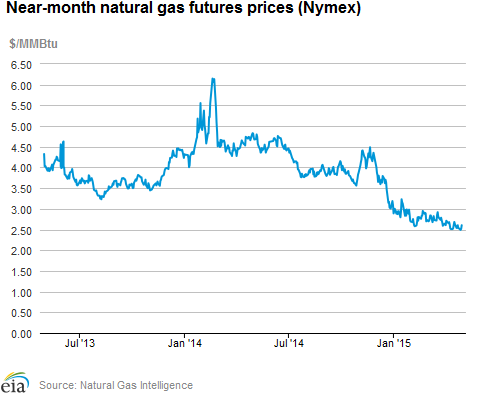
- At the New York Mercantile Exchange (Nymex), the June contract yesterday moved into front-month position. Before becoming the prompt month, it opened the report week last Wednesday at $2.654/MMBtu, dipped during the week, and ended at $2.606/MMBtu yesterday, down by a nickel.
- Working natural gas in storage increased to 1,710 billion cubic feet (Bcf) as of Friday, April 24, according to the U.S. Energy Information Administration (EIA) Weekly Natural Gas Storage Report (WNGSR). A net injection into storage of 81 Bcf for the week resulted in storage levels 76.5% above year-ago levels and 4.2% below the five-year average for this week.
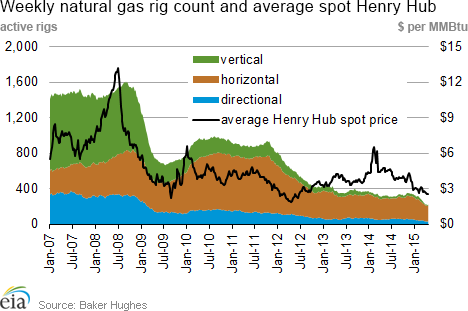
- The total rig count for April 24 fell by 22 units to 932 rigs, according to data reported by Baker Hughes Inc. Oil rigs fell by 31 units to 703; gas rigs increased by 8 to 225. This is the 20th consecutive week of double-digit declines in the oil rig count, but a potential turnaround for gas-directed drilling.
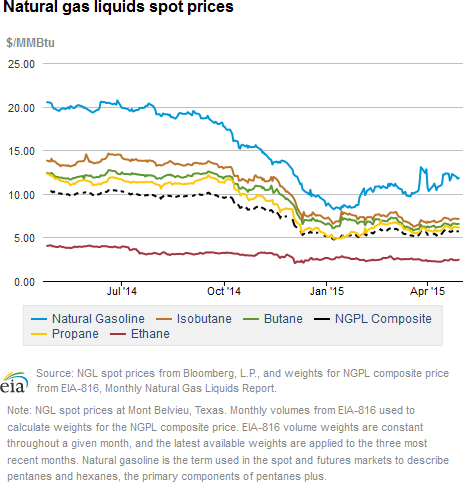
- The natural gas plant liquids composite price rose 9¢/MMBtu to $5.70/MMBtu, increasing about 2% for the week ending April 24. Mont Belvieu natural gas liquids spot prices were mixed this week. Isobutane prices fell by about 1%; propane and butane both increased by less than 1%; natural gasoline increased by 2%; and ethane increased by nearly 6%.
Prices/Demand/Supply:
Despite late-season cold weather, prices move down. Cooler temperatures this week had a minimal effect on prices, which moved down at most market locations. The East in particular saw unusually cold weather, stoking gas demand in the residential and commercial sectors, yet prices still declined slightly. Prices at Henry Hub fell a few cents, from $2.60/MMBtu last Wednesday to $2.56/MMBtu yesterday. Even in Chicago, where temperatures fell to freezing for parts of the week, prices at the Chicago Citygate decreased by a dime to $2.57/MMBtu.
Prices in the Northeast remain low. The Northeast, where much of the unseasonably cold spring temperatures occurred, saw across-the-board price decreases for the report week. Prices at the Algonquin Citygate, which serves Boston, fell by more than a dollar over the week, from $3.57/MMBtu last Wednesday to $2.52/MMBtu yesterday, closing a few cents below the Henry Hub price. Transcontinental Zone 6 New York, serving New York City, fell by 15¢ over the week, closing at $2.44/MMBtu yesterday, also below the Henry Hub price. In support of its Leidy Southeast Expansion project, Transcontinental Pipeline issued a notice on April 23 announcing that a segment of the Leidy Line, near Station 505 and Princeton Junction in New Jersey, will be out of service from May 1 through approximately June 12. Bentek Energy estimates that this maintenance could reduce flows through Leidy by 0.8 billion cubic feet per day (Bcf/d) or more on certain days, potentially constraining production in the region.
Prices at most Marcellus trading locations close the week sub-$1.50/MMBtu. At Tennessee's Zone 4 Marcellus trading location, prices opened the week at $1.14/MMBtu last Wednesday, fell to $1.02/MMBtu in trading on Tuesday, and closed the week at to $1.35/MMBtu yesterday. On the Transco Leidy Line, prices were $1.38/MMBtu last Wednesday, fluctuated, and closed at $1.42/MMBtu yesterday. At the Dominion South trading point, which serves customers in portions of Pennsylvania, Ohio, Maryland, West Virginia and Virginia, prices began the report week at $1.69/MMBtu, and fell through Friday to $1.43/MMBtu, eventually closing the week at $1.45/MMBtu yesterday.
Nymex prices down slightly. May's contract opened at $2.606/MMBtu last Wednesday, and ended its tenure as the near-month contract on Tuesday at $2.517/MMBtu, down by nearly a dime. The June 2015 Nymex contract started the week last Wednesday at $2.654/MMBtu, declined during the week, and ended down a nickel, at $2.606/MMBtu, yesterday. The 12-month strip, representing the average of the June 2015 through May 2016 contracts, fell by a few cents over the week, starting last Wednesday at $2.921/MMBtu and closing yesterday at $2.885/MMBtu .
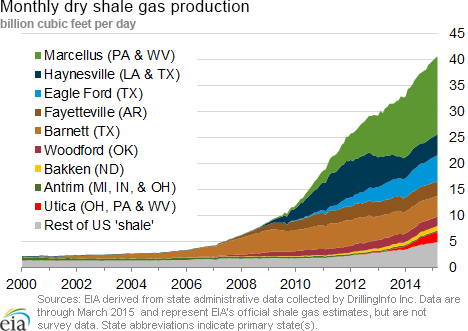
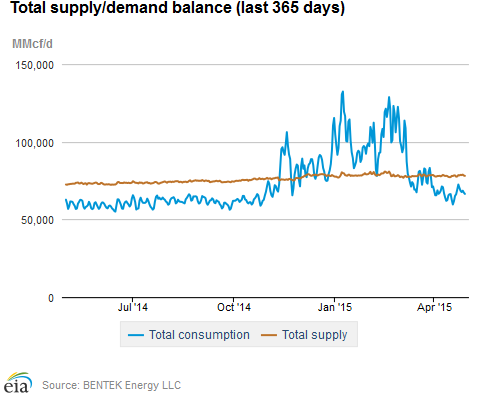
Total supply increases slightly. According to data from Bentek Energy, total supply increased 0.8% week over week, driven by production. Dry natural gas production increased 0.8%, 9.2% greater than the same week last year. Production on Monday reached a record high of 73.7 Bcf. Imports of Canadian natural gas into the United States were up slightly this week, rising 1.4%. Imports to the Northeast were particularly high on Thursday and Friday, when temperatures fell to nearly 30° Fahrenheit in some parts of the region. LNG sendout was down slightly, and volumes remain minimal.
Consumption increases on cold weather. Total natural gas consumption rose by 6.7% week over week, with increased demand in every sector. The residential/commercial sector rose by 18.4% on late-season heating demand from cold weather early in the report week. Industrial consumption was up 2.5%. Natural gas consumption for electric generation increased 0.4% for the week, up by more than 16% over the same period in 2014. Trends were mixed regionally, with the two biggest gas-consuming regions for electric power, the Northeast and the Southeast, up 7.5% and 2.9%, respectively. The Southwest and Texas both consumed less natural gas in this sector during the report week. Exports to Mexico were up 11.9% this week, which is 29.5% higher than this week last year.
Storage
Net storage injection is larger than both five-year average and last year's builds. The net injection reported for the week ending April 24 was 81 Bcf, down from 90 Bcf last week. This compares with the five-year average net increase of 55 Bcf for that week and last year's net increase of 77 Bcf. Working gas inventories for the storage week totaled 1,710 Bcf, 741 Bcf (76.5%) higher than last year at this time and 75 Bcf (4.2%) lower than the five-year (2010-14) average.
Storage injections are lower than market expectations. Market expectations, on average, called for a build of 86 Bcf. With the lower-than-expected injection, when the EIA storage report was released at 10:30 a.m. on April 30, the price for the June natural gas futures contract increased 11¢ to around $2.67/MMBtu in trading on the Nymex.
From the week ending on April 3 (the beginning of the injection season) through the week ending on April 24, net storage injections have totaled 249 Bcf versus 136 Bcf for the same 4 weeks in 2014, and 134 Bcf for these weeks between 2010 and 2014, on average. The estimated average unit value of what storage holders put into storage from April 3 to April 24 this year was $2.62/MMBtu, 44% lower than the average value for the same 4 weeks last year of $4.67/MMBtu. The highest winter-month Nymex price (for the January 2016 contract) in trading for the week ending on April 24 averaged $3.14/MMBtu. This is 56¢ more than the May Nymex contract price. A year ago, the difference was 20¢/MMBtu, suggesting there is more financial incentive this year to buy and store gas in the summer for sale in the winter.
There are currently 27 more weeks in the injection season, which traditionally occurs April 1 through October 31, although in many years injections continue into November. EIA forecasts that the end-of-October working natural gas inventory level will be 3,781 Bcf, which, as of April 24, would require an average injection of 77 Bcf per week through the end of October. EIA's forecast for the end-of-October inventory levels are below the five-year (2010-14) average peak storage value of 3,813 Bcf. To reach the five-year average peak value, average weekly injections through the end of October would need to be 78 Bcf.
All three regions report net injections for the week. The East, West, and Producing regions had net injections of 37 Bcf (9 Bcf larger than its five-year average injection), 4 Bcf (4 Bcf smaller than its five-year average), and 40 Bcf (20 Bcf larger than its five-year average), respectively. The East region's inventory is below its five-year average by 156 Bcf (20.7%). In contrast, stock levels in the West and Producing regions are above their five-year averages for the week, by 73 Bcf (25.3%) and 7 Bcf (0.9%), respectively. Storage levels for the East, West, and Producing regions are above their year-ago levels by 240 Bcf, 172 Bcf, and 329 Bcf, respectively.
Temperatures during the storage report week warmer than normal. Temperatures in the Lower 48 states averaged 56.9° for the storage report week, 2.1° warmer than the 30-year normal temperature and 2.0° warmer than the average temperature during the same week last year. There were 67 population-weighted heating degree days during the storage report week, 1 less than the five-year average and 10 fewer than during the same period last year. There were also 10 population-weighted cooling degree days during the same report week.
See also:
| Spot Prices ($/MMBtu) | Thu, 23-Apr |
Fri, 24-Apr |
Mon, 27-Apr |
Tue, 28-Apr |
Wed, 29-Apr |
|---|---|---|---|---|---|
| Henry Hub |
2.55 |
2.56 |
2.48 |
2.53 |
2.56 |
| New York | 2.58 |
2.21 |
2.52 |
2.41 |
2.44 |
| Chicago | 2.61 |
2.60 |
2.52 |
2.54 |
2.57 |
| Cal. Comp. Avg,* |
2.59 |
2.53 |
2.52 |
2.57 |
2.60 |
| Futures ($/MMBtu) | |||||
| May Contract | 2.531 |
2.531 |
2.490 |
2.517 |
Expired |
| June Contract | 2.569 |
2.568 |
2.514 |
2.537 |
2.606 |
| July Contract | 2.629 |
2.626 |
2.569 |
2.591 |
2.659 |
| *Avg. of NGI's reported prices for: Malin, PG&E citygate, and Southern California Border Avg. | |||||
| Source: NGI's Daily Gas Price Index | |||||
| U.S. natural gas supply - Gas Week: (4/22/15 - 4/29/15) | ||
|---|---|---|
Percent change for week compared with: |
||
last year |
last week |
|
| Gross production | 9.33%
|
0.76%
|
| Dry production | 9.24%
|
0.75%
|
| Canadian imports | 10.75%
|
1.38%
|
| West (net) | 23.22%
|
0.13%
|
| Midwest (net) | -2.67%
|
-11.90%
|
| Northeast (net) | -12.63%
|
-412.19%
|
| LNG imports | -66.83%
|
-9.03%
|
| Total supply | 9.22%
|
0.79%
|
| Source: BENTEK Energy LLC | ||
| U.S. consumption - Gas Week: (4/22/15 - 4/29/15) | ||
|---|---|---|
Percent change for week compared with: |
||
last year |
last week |
|
| U.S. consumption | 8.4%
|
6.6%
|
| Power | 16.4%
|
0.4%
|
| Industrial | 0.7%
|
2.5%
|
| Residential/commercial | 8.4%
|
18.4%
|
| Total demand | 9.0%
|
6.7%
|
| Source: BENTEK Energy LLC | ||
| Rigs | |||
|---|---|---|---|
Fri, April 24, 2015 |
Change from |
||
last week |
last year |
||
| Oil rigs | 703 |
-4.22% |
-54.17% |
| Natural gas rigs | 225 |
3.69% |
-30.34% |
| Miscellaneous | 4 |
33.33% |
0.00% |
| Rig numbers by type | |||
|---|---|---|---|
Fri, April 24, 2015 |
Change from |
||
last week |
last year |
||
| Vertical | 121 |
-0.82% |
-69.60% |
| Horizontal | 720 |
-2.83% |
-42.17% |
| Directional | 91 |
0.00% |
-58.26% |
| Source: Baker Hughes Inc. | |||
| Working gas in underground storage | ||||
|---|---|---|---|---|
Stocks billion cubic feet (bcf) |
||||
| Region | 2015-04-24 |
2015-04-17 |
change |
|
| East | 597 |
560 |
37 |
|
| West | 361 |
357 |
4 |
|
| Producing | 752 |
712 |
40 |
|
| Total | 1,710 |
1,629 |
81 |
|
| Source: U.S. Energy Information Administration | ||||
| Working gas in underground storage | |||||
|---|---|---|---|---|---|
Historical comparisons |
|||||
Year ago (4/24/14) |
5-year average (2010-2014) |
||||
| Region | Stocks (Bcf) |
% change |
Stocks (Bcf) |
% change |
|
| East | 357 |
67.2 |
753 |
-20.7 |
|
| West | 189 |
91.0 |
288 |
25.3 |
|
| Producing | 423 |
77.8 |
745 |
0.9 |
|
| Total | 969 |
76.5 |
1,785 |
-4.2 |
|
| Source: U.S. Energy Information Administration | |||||
| Temperature -- heating & cooling degree days (week ending Apr 23) | ||||||||
|---|---|---|---|---|---|---|---|---|
HDD deviation from: |
CDD deviation from: |
|||||||
| Region | HDD Current |
normal |
last year |
CDD Current |
normal |
last year |
||
| New England | 103
|
-18
|
-35
|
0
|
0
|
0
|
||
| Middle Atlantic | 82
|
-23
|
-36
|
0
|
0
|
0
|
||
| E N Central | 99
|
-9
|
0
|
0
|
0
|
0
|
||
| W N Central | 102
|
4
|
6
|
0
|
-1
|
0
|
||
| South Atlantic | 30
|
-19
|
-39
|
32
|
14
|
18
|
||
| E S Central | 34
|
-10
|
-8
|
6
|
1
|
4
|
||
| W S Central | 18
|
-1
|
-7
|
29
|
5
|
5
|
||
| Mountain | 93
|
-11
|
24
|
7
|
-2
|
-5
|
||
| Pacific | 37
|
-24
|
-2
|
0
|
-4
|
0
|
||
| United States | 67
|
-13
|
-10
|
10
|
2
|
4
|
||
|
Note: HDD = heating degree-day; CDD = cooling degree-day Source: National Oceanic and Atmospheric Administration | ||||||||
Average temperature (°F)
7-Day Mean ending Apr 23, 2015
Source: NOAA/National Weather Service
Deviation between average and normal (°F)
7-Day Mean ending Apr 23, 2015
Source: NOAA/National Weather Service