In the News:
Led by growth in Texas, the Southeast, and Northeast, power burn is headed for a January record
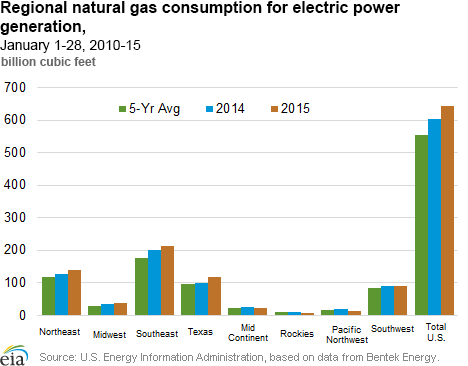
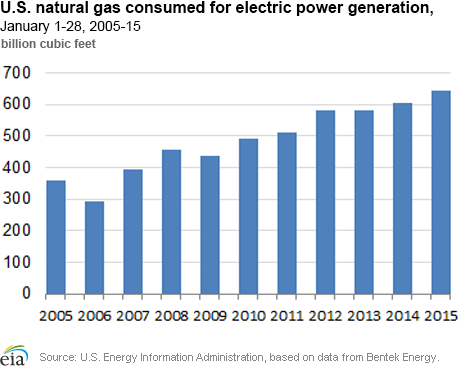
Natural gas consumed in electric generation (power burn) has generally increased over the past 10 years, and power burn during the first 28 days of January is at record levels this year, according to data from Bentek Energy. So far in January 2015, power burn is more than 6% greater than the same period in 2014, and 16% higher than the five-year (2010-14) average for this period.
Regional growth for power burn is strongest in Texas, which increased its power burn so far this January by 17.5 billion cubic feet (Bcf), an 18% increase over 2014. Strong power burn growth this January also occurred in the Northeast and Southeast, which had power burn increases of 10% (12.5 Bcf) and 7% (13.5 Bcf), respectively. These three regions are among the largest users of natural gas for power generation in the country.
Contributing to this growth is an increasing share of natural gas-fired capacity and relatively low natural gas prices. From January through November 2014, 66 power plant units, with a total net summer capacity of 3,787 megawatts (MW), were retired in 19 states. The primary generation fuels for these plants were coal and petroleum liquids. More than half of the generating capacity retired during this period came from the Southeast and Northeast. In the Southeast, this included the 200-MW W. S. Lee power plant in South Carolina and the 444-MW Widows Creek facility in Alabama, both coal-fired. And in the Northeast, the Salem Harbor 744-MW coal-and-oil-fired facility in Massachusetts was retired. Additionally, in December, the 604-MW Vermont Yankee nuclear power plant was closed.
More than 300 utility-scale generating units, with a net summer capacity of 9,656 MW, were brought online in January-November 2014, with 46 being natural gas-fired units representing 48% (4,624 MW) of the total added capacity. Most of the added natural gas-fired plant capacity resides in the Southeast and Texas. In the Southeast, this includes the 1,212-MW Florida Power and Light Riviera plant and the 696-MW Kemper County's Mississippi Power generator, which will initially burn natural gas and then shift to coal as the primary fuel source, backed up by natural gas. Texas is home to more than 1,550 MW of the new gas-fired capacity, distributed among the Channel Energy, Deer Park, Thomas C. Ferguson, and Panda Sherman power stations.
Last month, the power sector planned to retire more than 17,000 MW of net summer capacity from December 2014 through 2015, of which 78% is coal-fired and 13% is gas-fired. At the same time there were 65 natural gas-fired units under construction or waiting to come online before 2016, with an estimated capacity of more than 10,000 MW. The majority of these plants are being built in the same regions where growth dominated in 2014, with 3,109 MW in the Southeast, 3,948 MW in the Northeast, and 1,269 MW in Texas. The capacity of non-natural gas-fired generation plants under construction exceed 15,000 MW, with 61% based on renewable sources and 36% nuclear powered (in-service dates to 2019).
Power burn is highly seasonal, peaking during the summer rather than the winter months like other sectors. This is because electricity bumps up during the summer air conditioning season but is not the primary contributor to space heating in the colder regions of the United States. However, with cold temperatures, power burn typically increases in the southern regions where electricity is the primary source for heating. This month's weather has been comparable to January 2014, and both years saw increases in power burn during cold snaps.
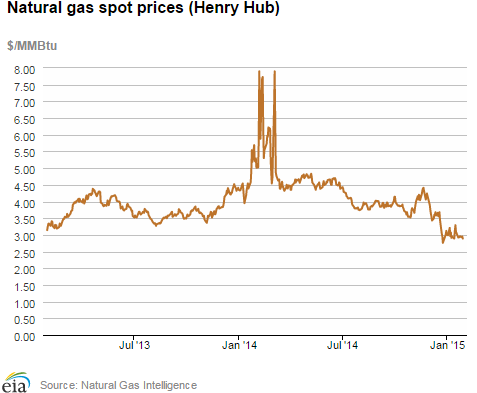
Prices, however, have been lower in 2015, which contributes to the economics of generating more electricity from natural gas. In the first four weeks of January, spot prices at the benchmark Henry Hub have averaged $3.00 per million British thermal units (MMBtu), 35% lower than the same time period in 2014. Prices at Northeast trading points are also lower this year, with average spot prices at the Algonquin Citygate (Boston) and Transco Zone 6 NY (New York) trading locations 64% and 77% lower than January 2014, respectively.
Overview:
(For the Week Ending Wednesday, January 28, 2015)
- Natural gas spot prices fell over the report week (Wednesday to Wednesday) at most trading locations outside of the Northeast, where price movements were mixed. The Henry Hub spot price fell from $2.94/MMBtu last Wednesday, January 21, to $2.89/MMBtu yesterday, January 28.
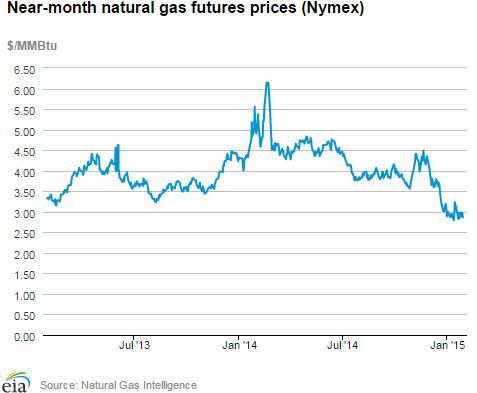
- At the New York Mercantile Exchange (Nymex), the price of the February 2015 futures contract fell 10.8¢ over the report week and expired on Wednesday at $2.866/MMBtu.
- Working natural gas in storage decreased to 2,543 Bcf as of Friday, January 23, according to the U.S. Energy Information Administration (EIA) Weekly Natural Gas Storage Report (WNGSR). A net withdrawal from storage of 94 Bcf for the week resulted in storage levels 14.6% above year-ago levels and 3.0% below the five-year average for this week.
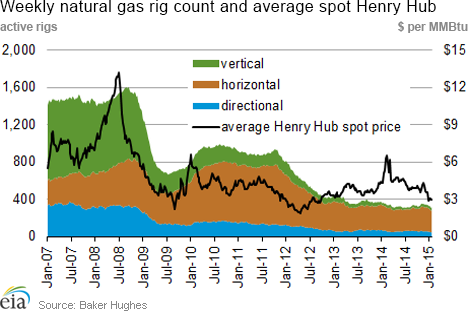
- The total U.S. rotary rig count decreased by 43 active units to 1,633 rigs for the week ending January 23, according to data from Baker Hughes Inc. The natural gas rig count rose by 6 units to 316, while the oil rig count fell by 49 to 1,317. The largest decline in oil rigs occurred in the Bakken, where the rig count fell by 13.
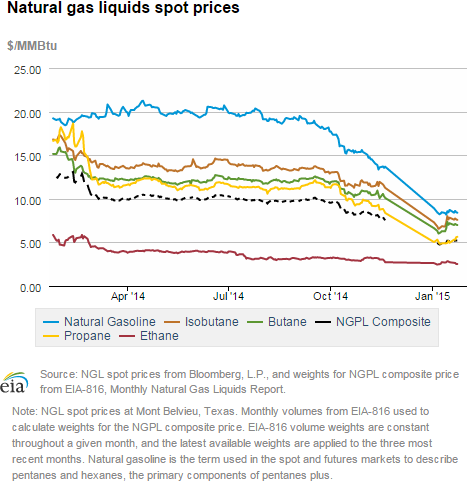
- The natural gas plant liquids composite price rose by 12¢ this week, increasing 2.5% from $5.08/MMBtu to $5.20/MMBtu. With the exception of ethane, which fell 6.3%, all Mont Belvieu NGL spot prices were up this week, with the strongest growth occurring in propane, which rose 9.9%.
Prices/Demand/Supply:
Despite cold, most prices fall. The Henry Hub spot price fell from $2.94/MMBtu last Wednesday to $2.89/MMBtu yesterday. Most Gulf and Midcontinent area prices fell by a few cents, with slightly larger declines in the Rockies and California. At the Malin Hub in Northern California, prices fell from $2.80/MMBtu to $2.67/MMBtu from Wednesday to Wednesday. Similarly, at the Opal trading point in Wyoming, prices fell 13¢ from $2.75/MMBtu to $2.62/MMBtu.
Northeast prices rise midweek. Prices in the Northeast rose Monday in anticipation of a blizzard. At Transcontinental Pipeline’s Zone 6 trading point for delivery into New York City (Transco Z6 NY), prices rose to $12.38/MMBtu on January 26, the day before the storm. Over the entire report week, prices at Transco Z6 NY rose 48¢ from $3.27/MMBtu last Wednesday to $3.75/MMBtu yesterday. In Boston, at the Algonquin Citygate, prices began the week at $7.75/MMBtu, rose to $10.72/MMBtu on Monday, and dropped back to $8.96/MMBtu yesterday. Compared to last year’s swings in prices in the Northeast, however, this year’s price swings in the Northeast have been comparatively mild.
Marcellus-area prices mostly drop. Marcellus-area prices remain far below the national benchmark. Prices at Tennessee’s Zone 4 trading region, which represents Marcellus deliveries into Tennessee’s system, fell from $1.15/MMBtu at the beginning of the report week to $1.12/MMBtu at the end of the report week. On Transco’s Leidy Line, prices fell from $1.15/MMBtu last Wednesday to $1.11 MMBtu yesterday. Other Marcellus-area prices were similar with an exception at Dominion South, which represents deliveries going east on Dominions system from Ohio and West Virginia, where prices rose 27¢ from $1.57/MMBtu to $1.84/MMBtu.
Nymex prices drop. The February near-month contract fell from $2.974/MMBtu last Wednesday to $2.866/MMBtu yesterday, the date it expired. The February contract lost 22.3¢ during its time as the front-month contract. The 12-month strip (the average of the contracts between February 2015 and January 2016) fell from $3.060/MMBtu last Wednesday to $2.996/MMBtu yesterday. As of yesterday, all contracts until November 2015 were less than $3/MMBtu, and the next contract where prices are greater than $4/MMBtu is four years from now. The last time a February contract closed at less than $3/MMBtu was in 2012, during a record warm winter.
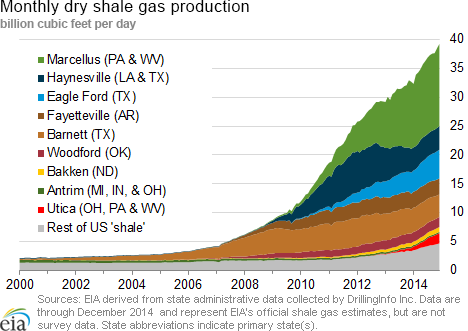
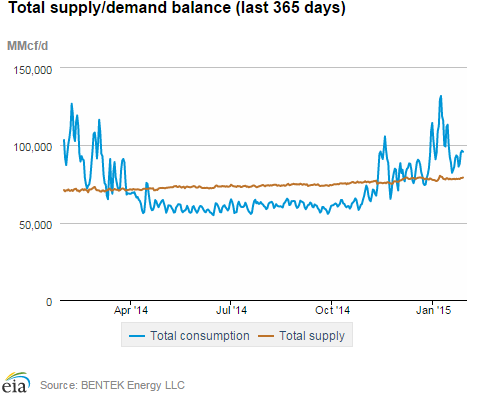
Production rises. Dry natural gas production rose 0.8% from last week, according to data from Bentek Energy. Production continues to recover from supply disruptions from freeze-offs earlier this month. Production is 12.2% greater than year-ago levels. Canadian imports fell 0.3% week-over-week, with increases in imports to the Northeast and West and declines in imports to the Midwest. LNG sendout declined from the previous week.
Consumption increases. Domestic consumption rose 3.3% from the previous week, but was 22.1% less than year-ago levels. Residential and commercial consumption increased 4.9% week-over-week, while industrial consumption increased 0.9%. Consumption of gas for power generation rose 2.9%, and is 12.1% less than year-ago levels.
Storage
Net withdrawal is lower than both the five-year average and last year’s withdrawal. The net withdrawal reported for the week ending January 23 was 94 Bcf, 74 Bcf lower than the five-year average net withdrawal for that week, and 125 Bcf lower than last year’s net withdrawal. Working gas inventories as of January 23 totaled 2,543 Bcf, 324 Bcf (14.6%) higher than last year at this time and 79 Bcf (3.0%) lower than the five-year (2010-14) average.
Storage withdrawals are lower than market expectations. Market expectations, on average, called for a pull of 111 Bcf. When the EIA storage report was released at 10:30 a.m. on January 29, the price for the March natural gas futures contract decreased 11¢, to $2.73/MMBtu, in trading on the Nymex. In the next hour, prices decreased an additional 5¢. Stocks in all three regions are above their year-ago levels. Storage levels for the East, West, and Producing regions were above their year-ago levels by 200 Bcf, 45 Bcf, and 79 Bcf, respectively, but the East and Producing regions remain below their five-year average levels. The West region is now above its five-year average level by 4 Bcf. The East, West, and Producing regions had net withdrawals of 69 Bcf (35 Bcf lower than its five-year average withdrawal), 9 Bcf (11 Bcf lower), and 16 Bcf (29 Bcf lower), respectively. Temperatures during the storage report week are warmer than normal. Temperatures in the Lower 48 states averaged 38.9° for the storage report week, 5.7° warmer than the 30-year normal temperature and 5.3° warmer than the temperatures during the same week last year. There were 184 population-weighted heating degree days during the storage report week, 7 fewer than the 5-year average and 36 fewer than during the same period last year.See also:
| Spot Prices ($/MMBtu) | Thu, 22-Jan |
Fri, 23-Jan |
Mon, 26-Jan |
Tue, 27-Jan |
Wed, 28-Jan |
|---|---|---|---|---|---|
| Henry Hub |
2.93 |
2.96 |
2.93 |
2.95 |
2.89 |
| New York |
3.26 |
8.75 |
12.38 |
9.99 |
3.75 |
| Chicago |
2.87 |
2.89 |
2.85 |
2.88 |
2.85 |
| Cal. Comp. Avg,* |
2.95 |
2.92 |
2.87 |
2.91 |
2.85 |
| Futures ($/MMBtu) | |||||
| February contract |
2.835 |
2.986 |
2.881 |
2.981 |
2.866 |
| March contract |
2.827 |
2.958 |
2.848 |
2.935 |
2.842 |
| *Avg. of NGI's reported prices for: Malin, PG&E citygate, and Southern California Border Avg. | |||||
| Source: NGI's Daily Gas Price Index | |||||
| U.S. natural gas supply - Gas Week: (1/21/15 - 1/28/15) | ||
|---|---|---|
Percent change for week compared with: |
||
last year |
last week |
|
| Gross production | 12.35%
|
0.85%
|
| Dry production | 12.23%
|
0.84%
|
| Canadian imports | -19.13%
|
-0.34%
|
| West (net) | -0.73%
|
3.63%
|
| Midwest (net) | -43.54%
|
-15.69%
|
| Northeast (net) | -18.22%
|
10.44%
|
| LNG imports | -15.82%
|
-38.41%
|
| Total supply | 8.86%
|
0.52%
|
| Source: BENTEK Energy LLC | ||
| U.S. consumption - Gas Week: (1/21/15 - 1/28/15) | ||
|---|---|---|
Percent change for week compared with: |
||
last year |
last week |
|
| U.S. consumption | -22.1%
|
3.3%
|
| Power | -12.1%
|
2.9%
|
| Industrial | -3.5%
|
0.9%
|
| Residential/commercial | -32.5%
|
4.9%
|
| Total demand | -21.2%
|
3.6%
|
| Source: BENTEK Energy LLC | ||
| Rigs | |||
|---|---|---|---|
Fri, January 23, 2015 |
Change from |
||
last week |
last year |
||
| Oil rigs | 1,317 |
-3.59% |
-6.99% |
| Natural gas rigs | 316 |
1.94% |
-11.24% |
| Miscellaneous | 0 |
0.00% |
-100.00% |
| Rig numbers by type | |||
|---|---|---|---|
Fri, January 23, 2015 |
Change from |
||
last week |
last year |
||
| Vertical | 258 |
-4.44% |
-34.85% |
| Horizontal | 1,229 |
-1.92% |
5.04% |
| Directional | 146 |
-4.58% |
-30.81% |
| Source: Baker Hughes Inc. | |||
| Working gas in underground storage | ||||
|---|---|---|---|---|
Stocks billion cubic feet (bcf) |
||||
| Region | 2015-01-23 |
2015-01-16 |
change |
|
| East | 1,281 |
1,350 |
-69 |
|
| West | 375 |
384 |
-9 |
|
| Producing | 887 |
903 |
-16 |
|
| Total | 2,543 |
2,637 |
-94 |
|
| Source: U.S. Energy Information Administration | ||||
| Working gas in underground storage | |||||
|---|---|---|---|---|---|
Historical comparisons |
|||||
Year ago (1/23/14) |
5-year average (2010-2014) |
||||
| Region | Stocks (Bcf) |
% change |
Stocks (Bcf) |
% change |
|
| East | 1,081 |
18.5 |
1,321 |
-3.0 |
|
| West | 330 |
13.6 |
371 |
1.1 |
|
| Producing | 808 |
9.8 |
930 |
-4.6 |
|
| Total | 2,219 |
14.6 |
2,622 |
-3.0 |
|
| Source: U.S. Energy Information Administration | |||||
| Temperature -- heating & cooling degree days (week ending Jan 22) | ||||||||
|---|---|---|---|---|---|---|---|---|
HDD deviation from: |
CDD deviation from: |
|||||||
| Region | HDD Current |
normal |
last year |
CDD Current |
normal |
last year |
||
| New England | 262
|
-13
|
4
|
0
|
0
|
0
|
||
| Middle Atlantic | 258
|
-5
|
-17
|
0
|
0
|
0
|
||
| E N Central | 237
|
-60
|
-91
|
0
|
0
|
0
|
||
| W N Central | 216
|
-101
|
-86
|
0
|
0
|
0
|
||
| South Atlantic | 157
|
-26
|
-44
|
4
|
-4
|
4
|
||
| E S Central | 149
|
-40
|
-65
|
0
|
-2
|
0
|
||
| W S Central | 104
|
-35
|
-15
|
0
|
-4
|
0
|
||
| Mountain | 190
|
-41
|
1
|
0
|
0
|
0
|
||
| Pacific | 83
|
-35
|
25
|
0
|
-1
|
0
|
||
| United States | 184
|
-41
|
-36
|
1
|
-1
|
1
|
||
|
Note: HDD = heating degree-day; CDD = cooling degree-day Source: National Oceanic and Atmospheric Administration | ||||||||
Average temperature (°F)
7-Day Mean ending Jan 22, 2015
Source: NOAA/National Weather Service
Deviation between average and normal (°F)
7-Day Mean ending Jan 22, 2015
Source: NOAA/National Weather Service