In the News:
Despite higher gas prices, winter heating bills expected to fall
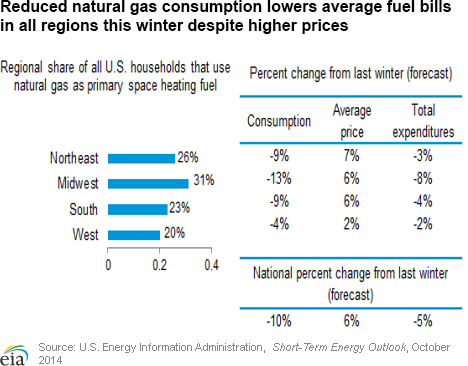
The U.S. Energy Information Administration (EIA) said earlier this week that consumption of natural gas for space heating this winter will decrease nationwide compared with last winter, resulting in a 5% reduction in residential fuel bills, despite higher-per-unit fuel prices.
EIA added that household use of all heating fuels will decrease this winter, as closer-to-normal temperatures are expected. Last year's unusually cold winter resulted in considerably higher consumption of the space heating sources, including natural gas, electricity, heating oil, and propane.
Although regional markets vary in both consumption and price changes, all regions are forecasted to save on fuel bills this winter, despite higher prices expected for the season. During the 2013-14 winter, natural gas consumption for residential space heating averaged 68,000 cubic feet per household, and cost approximately $9.99 per thousand cubic feet (Mcf). The forecast for winter 2014-15 anticipates a 10% reduction in average household consumption, to 61.4 Mcf, priced at $10.57/Mcf, a 6% price increase over a year ago.
EIA’s forecast is largely based on the heating degree day (HDD) forecast from the National Oceanic and Atmospheric Administration (NOAA). NOAA forecasts that HDDs in the United State this winter will be 12% lower, from 4,114 during the 2013-14 winter to 3,633 for the upcoming winter season. A heating degree day is based on a differential from the comfort level of 65 degrees F.
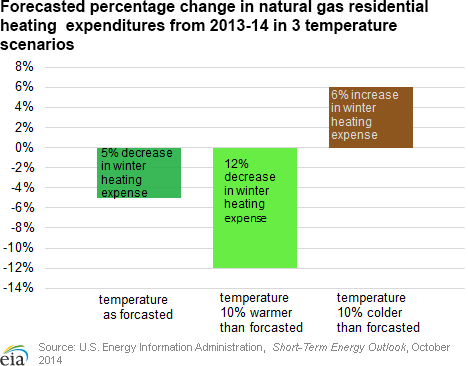
A forecast of 10% warmer weather results in a 12% ($82) decrease compared with last winter, taking average household expenses down to $598 for the season. Temperatures 10% colder than forecasted would generate a 6% increase in home heating expense for natural gas households over last winter, adding $40 to total expenditures and raising the average heating expense to $720. The number of heating degree days for a 10% colder season this winter (3,996) would still be less than experienced in 2013-14 (4,114).
Natural gas is the most widely used source for space heating in the United States, with 49% of the nation’s 119 million households relying on natural gas during the past winter (October 2013-March 2014), while 39% heat with electricity, 5.5% with heating oil, 4.8% with propane, and 2.2% with wood or some other fuel.
Overview:
(For the Week Ending Wednesday, October 8, 2014)
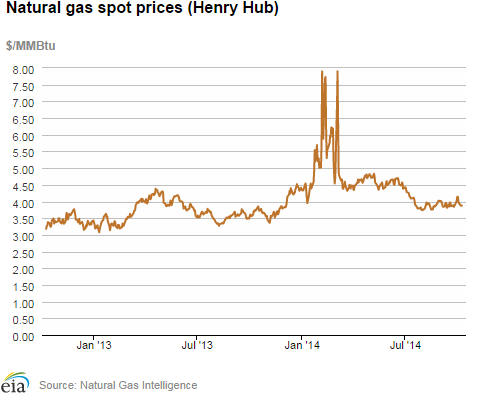
- Spot prices fell early in the report week (Wednesday, October 1, to Wednesday, October 8) and ended the week lower overall. The Henry Hub spot price fell from $4.14/million British thermal units (MMBtu) last Wednesday to $3.88/MMBtu yesterday, a decline of $0.26 over the week.
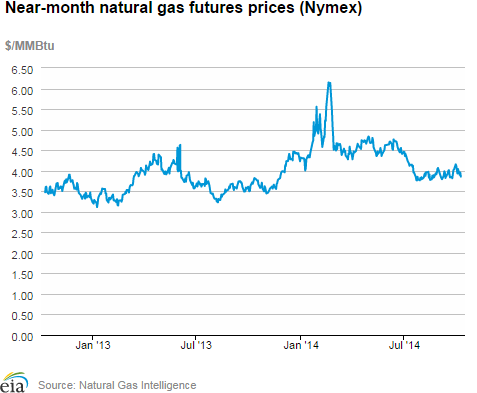
- At the New York Mercantile Exchange (Nymex) the near-month (November 2014) contract started the report week at $4.023/MMBtu last Wednesday and settled at $3.855/MMBtu yesterday, October 8.
- Working natural gas in storage rose to 3,205 billion cubic feet (Bcf) as of Friday, October 3, according to the U.S. Energy Information Administration (EIA) Weekly Natural Gas Storage Report (WNGSR). A net increase in storage of 105 Bcf for the week resulted in storage levels 10.1% below year-ago levels and 10.5% below the five-year average for this week.
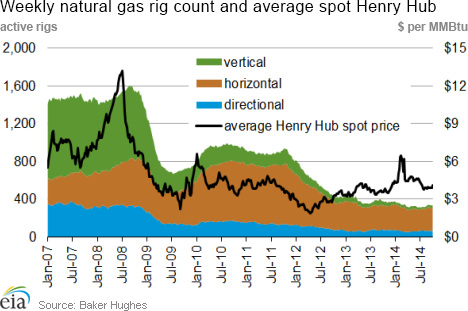
- The total U.S. rig count fell 9 units for the week to 1,922 as of October 3, according to Baker Hughes Inc. Oil rigs, at 1,591, were down 1, while gas rigs fell by 8 units to a count of 330. Oil rigs were up 219 units from a year ago, while gas rigs were down by 48.
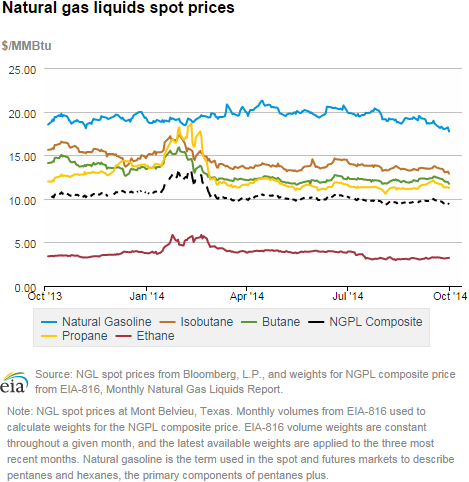
- The Mont Belvieu natural gas plant liquids composite price fell 1.5%, or $0.14/MMBtu, to $9.44/MMBtu for the week covering September 28 – October 3. The ethane price rose 0.8%, while the prices of natural gasoline, propane, butane, and isobutane fell 0.9%, 2.0%, 3.1%, and 2.5% respectively.
Prices/Demand/Supply:
Natural gas prices down over the week. Mild temperatures led to natural gas price decreases at most market locations across the country. The biggest decrease occurred at the Algonquin Citygate, which serves Boston. Prices at Algonquin started the report week last Wednesday at $4.24/MMBtu, and fell $2.29/MMBtu to $1.95/MMBtu heading into the weekend. This was likely driven by temperatures that were forecasted to be in the mid-60 degrees in Boston over the weekend, signaling weak natural gas consumption in the residential and electric sectors. Prices rebounded on Monday, accompanied by warmer temperatures and continuing maintenance outages at Algonquin’s Cromwell Compressor Station. Overall, prices at Algonquin were down $0.90/MMBtu over the report week, settling yesterday at $3.34/MMBtu. A similar pattern of prices falling through the weekend, and marginally rebounding after Monday occurred throughout the Northeast. For example, at Transcontinental Pipeline’s Zone 6 delivery point, which serves New York, prices began the week at $2.24/MMBtu, fell to $1.51/MMBtu on Friday, and ended the report week at $1.98/MMBtu. Prices at both New York and Boston remained below Henry Hub for most days during the report week. Henry Hub spot prices started the week at $4.14/MMBtu but fell off to $3.88/MMBtu yesterday.
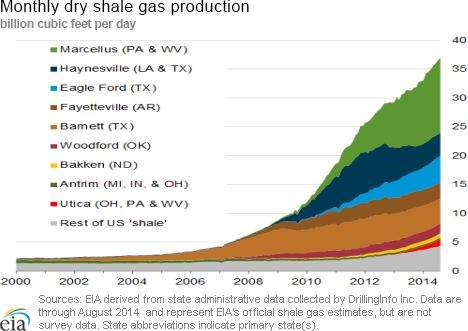
Marcellus prices remain low. Prices in the Marcellus Shale remained low and had fluctuations, tracking along with Algonquin Citygate and Transcontinental Zone 6 NY through the week. At the end of the report week, prices at the major Marcellus trading hubs were under $2.00/MMBtu.
Prices at the Nymex also drop. The price of the near-month (November 2014) contract fell from $4.023/MMBtu last Wednesday to $3.855/MMBtu yesterday. The 12-month strip (the average of the 12 contracts between November 2014 and October 2015) closed the report week at $3.840, down from Wednesday, October 1, when the 12-month strip averaged $3.962.
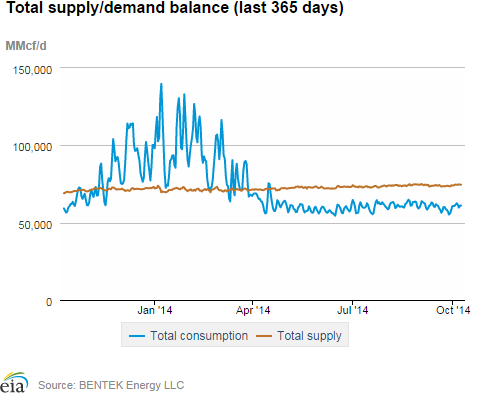
Supply up this week. Dry gas production rose 0.5% during the week, according to data from Bentek Energy. Overall supply was up 1.0%, with increases in production further supported by a 7.9% increase in pipeline imports from Canada. LNG imports declined, and remain at minimal levels.
Total demand increases. Total demand was up 5.5% for the week, driven by increases in the industrial and residential sectors. Industrial and residential/commercial consumption rose week-to-week, by 1.3% and 30.1%, respectively, with the residential sector responding to cooler temperatures early in the season. Natural gas used for power generation fell 3.6% this week as most regions experienced lower demand with mild weather. Exports to Mexico declined by 3.4%.
Storage
Second straight week of triple-digit net injections. The net injection reported for the week ending October 3 was 105 Bcf, 21 Bcf larger than the five-year average net injection of 84 Bcf and 14 Bcf larger than last year's net injection of 91 Bcf. Working gas inventories totaled 3,205 Bcf, 359 Bcf (10.1%) less than last year at this time and 378 Bcf (10.5%) below the five-year (2009-13) average.
Storage build lower than expectations. Market expectations called for an average build of 109 Bcf. When the EIA storage report was released at 10:30 a.m., the price for the November natural gas futures contract rose 4 cents to $3.88/MMBtu in trading on the Nymex.
From the week ending on April 4 through the week ending on October 3, net storage injections totaled 2,383 Bcf versus 1,864 Bcf for the same 27 weeks in 2013, and 1,769 Bcf for these weeks between 2009 and 2013, on average. The average unit value of what storage holders put into storage from April 4 to October 3 was $4.27/MMBtu, 13% higher than the average value for the same 27 weeks last year of $3.76/MMBtu. The highest winter-month Nymex price (for the January 2015 contract) in trading for the week ending on October 3 averaged $4.19/MMBtu. This is 16 cents more than the current front month Nymex contract price for that week. A year ago, the difference was 28 cents/MMBtu.
There currently are four more weeks in the injection season, which traditionally occurs April 1 through October 31, although in each of the past 11 years, injections continued into November. EIA forecasts that the end-of-October working natural gas inventory level will be 3,532 Bcf, which, as of October 7, would require an average injection of 82 Bcf per week through the end of October. EIA's forecast for the end-of-October inventory levels are below the five-year (2009-13) average peak storage value of 3,851 Bcf.
All regions post larger-than-average builds. The East, West, and Producing regions had net injections of 62 Bcf (14 Bcf larger than its five-year average), 11 Bcf (4 Bcf larger than its five-year average), and 32 Bcf (3 Bcf larger than its five-year average), respectively. Storage levels for all three regions remain below their year-ago and five-year average levels.
Temperatures during the storage report week were a few degrees warmer than the 30-year average. Temperatures in the Lower 48 states averaged 66.6 degrees for the week, 3.6 degrees warmer than the 30-year normal temperature and 1.3 degrees warmer than during the same period last year. There were 28 population-weighted cooling degree days during the storage report week, 5 higher than the 30-year normal and 4 higher than the same period last year.
See also:
| Spot Prices ($/MMBtu) | Thu, 02-Oct |
Fri, 03-Oct |
Mon, 06-Oct |
Tue, 07-Oct |
Wed, 08-Oct |
|---|---|---|---|---|---|
| Henry Hub |
3.99 |
3.95 |
3.88 |
3.87 |
3.88 |
| New York |
1.91 |
1.51 |
1.86 |
1.86 |
1.98 |
| Chicago |
3.97 |
3.95 |
3.93 |
3.93 |
3.96 |
| Cal. Comp. Avg,* |
4.13 |
4.06 |
4.03 |
4.06 |
4.07 |
| Futures ($/MMBtu) | |||||
| October Contract |
3.932 |
4.039 |
3.898 |
3.957 |
3.855 |
| November Contract |
4.012 |
4.117 |
3.987 |
4.052 |
4.012 |
| *Avg. of NGI's reported prices for: Malin, PG&E citygate, and Southern California Border Avg. | |||||
| Source: NGI's Daily Gas Price Index | |||||
| U.S. Natural Gas Supply - Gas Week: (10/1/14 - 10/8/14) | ||
|---|---|---|
Percent change for week compared with: |
||
last year |
last week |
|
| Gross Production | 9.41%
|
0.54%
|
| Dry Production | 9.31%
|
0.54%
|
| Canadian Imports | 28.97%
|
7.94%
|
| West (Net) | 7.78%
|
5.60%
|
| MidWest (Net) | 83.42%
|
13.03%
|
| Northeast (Net) | 1270.90%
|
38.12%
|
| LNG Imports | -94.45%
|
-9.38%
|
| Total Supply | 10.13%
|
1.01%
|
| Source: BENTEK Energy LLC | ||
| U.S. Consumption - Gas Week: (10/1/14 - 10/8/14) | ||
|---|---|---|
Percent change for week compared with: |
||
last year |
last week |
|
| U.S. Consumption | 5.5%
|
5.8%
|
| Power | -2.0%
|
-3.6%
|
| Industrial | 2.4%
|
1.3%
|
| Residential/Commercial | 22.8%
|
30.1%
|
| Total Demand | 5.2%
|
5.5%
|
| Source: BENTEK Energy LLC | ||
| Rigs | |||
|---|---|---|---|
Fri, October 03, 2014 |
Change from |
||
last week |
last year |
||
| Oil Rigs | 1,591 |
-0.06% |
15.96% |
| Natural Gas Rigs | 330 |
-2.37% |
-12.70% |
| Miscellaneous | 1 |
0.00% |
-83.33% |
| Rig Numbers by Type | |||
|---|---|---|---|
Fri, October 03, 2014 |
Change from |
||
last week |
last year |
||
| Vertical | 372 |
-0.27% |
-10.58% |
| Horizontal | 1,341 |
-0.45% |
22.02% |
| Directional | 209 |
-0.95% |
-13.28% |
| Source: Baker Hughes Inc. | |||
| Working Gas in Underground Storage | ||||
|---|---|---|---|---|
Stocks billion cubic feet (bcf) |
||||
| Region | 2014-10-03 |
2014-09-26 |
change |
|
| East | 1,776 |
1,714 |
62 |
|
| West | 464 |
453 |
11 |
|
| Producing | 965 |
933 |
32 |
|
| Total | 3,205 |
3,100 |
105 |
|
| Source: U.S. Energy Information Administration | ||||
| Working Gas in Underground Storage | |||||
|---|---|---|---|---|---|
Historical Comparisons |
|||||
Year ago (10/3/13) |
5-year average (2009-2013) |
||||
| Region | Stocks (Bcf) |
% change |
Stocks (Bcf) |
% change |
|
| East | 1,844 |
-3.7 |
1,934 |
-8.2 |
|
| West | 537 |
-13.6 |
504 |
-7.9 |
|
| Producing | 1,184 |
-18.5 |
1,145 |
-15.7 |
|
| Total | 3,564 |
-10.1 |
3,583 |
-10.5 |
|
| Source: U.S. Energy Information Administration | |||||
| Temperature -- Heating & Cooling Degree Days (week ending Oct 02) | ||||||||
|---|---|---|---|---|---|---|---|---|
HDD deviation from: |
CDD deviation from: |
|||||||
| Region | HDD Current |
normal |
last year |
CDD Current |
normal |
last year |
||
| New England | 29
|
-32
|
-17
|
3
|
2
|
3
|
||
| Middle Atlantic | 14
|
-36
|
-14
|
5
|
1
|
2
|
||
| E N Central | 31
|
-22
|
4
|
4
|
-1
|
0
|
||
| W N Central | 25
|
-28
|
6
|
23
|
15
|
3
|
||
| South Atlantic | 4
|
-18
|
-12
|
53
|
9
|
11
|
||
| E S Central | 3
|
-18
|
-4
|
47
|
18
|
8
|
||
| W S Central | 0
|
-4
|
-1
|
75
|
20
|
-4
|
||
| Mountain | 38
|
-18
|
-15
|
23
|
-3
|
6
|
||
| Pacific | 10
|
-8
|
-4
|
13
|
-6
|
3
|
||
| United States | 17
|
-20
|
-5
|
28
|
5
|
4
|
||
|
Note: HDD = heating degree-day; CDD = cooling degree-day Source: National Oceanic and Atmospheric Administration | ||||||||
Average temperature (°F)
7-Day Mean ending Oct 02, 2014
Source: NOAA/National Weather Service
Deviation between average and normal (°F)
7-Day Mean ending Oct 02, 2014
Source: NOAA/National Weather Service