In the News:
Brazil seeks more LNG to compensate for low hydro levels
The liquefied natural gas (LNG) carrier WilGas is due to arrive at the Guanabara Bay LNG terminal near Rio de Janeiro late this week to deliver a spot cargo of LNG that was re-exported from Europe. Re-exports of LNG occur when an LNG shipment is offloaded from a tanker into storage tanks at a regasification terminal and then subsequently reloaded onto tankers for delivery to another terminal, where it is ultimately regasified and delivered to a customer.
Petróleo Brasileiro S.A., or Petrobras, Brazil’s state-controlled oil and gas firm and the sole importer of LNG to the country, imported a record 2.833 million tons of LNG (equivalent to 0.56 billion cubic feet per day (Bcf/d) of natural gas) over the first eight months of 2014, including several spot LNG cargoes that were re-exported from Europe. Petrobras does not have any long-term contracts to buy LNG and buys what it needs under either spot or short-term contracts.
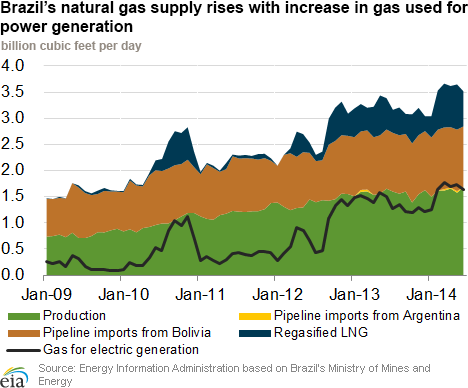
Brazil currently has three operating LNG regasification terminals with a total import capacity of 1.45 Bcf/d. The Guanabara Bay terminal was the first to open, in 2009, and the newest terminal opened in January 2014. Since 2009, LNG import levels have varied considerably. Imports spiked in the fall of 2010, as hydro levels fell and power generation from natural gas increased to meet power demand.
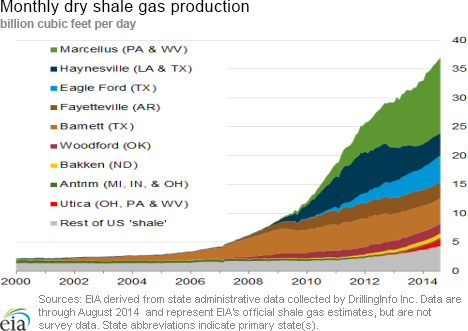
While LNG imports are the most important supply source in balancing demand swings, they are far from Brazil’s only supply source. Natural gas production in Brazil has grown rapidly since 2009 as Petrobras has increased production from the offshore Campos, Santos, and Espirito Santo basins. Marketed production in 2013 was double what it was in 2009, 1.57 Bcf/d versus 0.78 Bcf/d. Additionally, Brazil imported 1.12 Bcf/d of pipeline gas from Bolivia in 2013 as well as small volumes from Argentina.
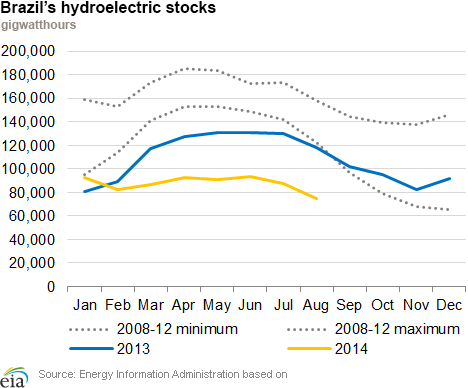
Brazil is extremely reliant on hydroelectricity to meet its demand for electric power. However, it is currently experiencing the worst drought in 40 years and has turned to gas-fired power generation to compensate for the lack of hydropower. Electricity generation from natural gas and other fossil fuels was at record high levels in August, while hydroelectric generation was at its lowest level since July 2005. Petrobras’s demand for LNG has been high in both 2013 and 2014 because of these low water levels at hydroelectric facilities.
Petrobras is actively trying to buy spot LNG for delivery in October, November, and December. November to May is usually the rainy season in Brazil, and future spot purchases will depend on how much rain the country gets this season.
Overview:
(For the Week Ending Wednesday, September 24, 2014)
- Prices rose in New England over the September 17-24 report week, with reported restrictions from Algonquin Gas Transmission (AGT). The price at Algonquin Citygate (Boston) rose from $2.64 per million British thermal units (MMBtu) to $4.77/MMBtu to close the week. Prices in the rest of the country stayed closer to their initial marks, with most not moving more than 5% in either direction through the week. Transco Zone 6 (New York) fell significantly, however, even as New England rose.
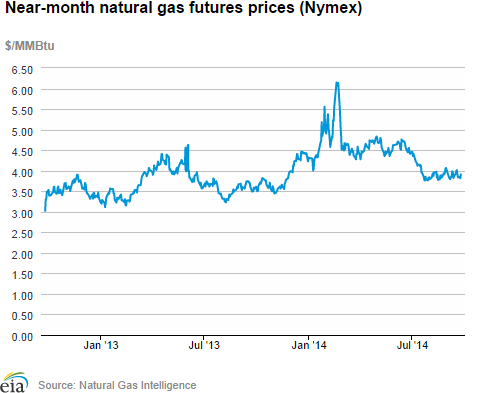
- At the New York Mercantile Exchange (Nymex) the price of the near-month (October 2014) contract fell through the week, from $4.013/MMBtu on Wednesday, September 17, to $3.816 on Tuesday, but rose a dime yesterday.
- Working natural gas in storage rose to 2,988 Bcf as of Friday, September 19, according to the U.S. Energy Information Administration (EIA) Weekly Natural Gas Storage Report (WNGSR). A net increase in storage of 97 billion cubic feet (Bcf) for the week resulted in storage levels 11.4% below year-ago levels and 12.5% below the five-year average for this week.
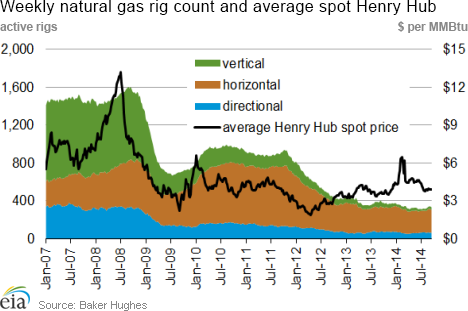
- The total rig count for the week ending September 19 remained the same, as reported September 12, at 1931, according to data from Baker Hughes Inc. This includes an increase of 4 land based rigs, offset by a reduction of 4 offshore rigs from the previous week. Rigs are now at 170 more units than last year’s level. The oil rig count rose by 9 to 1601, and is 232 units greater than last year. The natural gas rig count, however, declined by 9 units to 329 units, 57 rigs below year-ago levels.
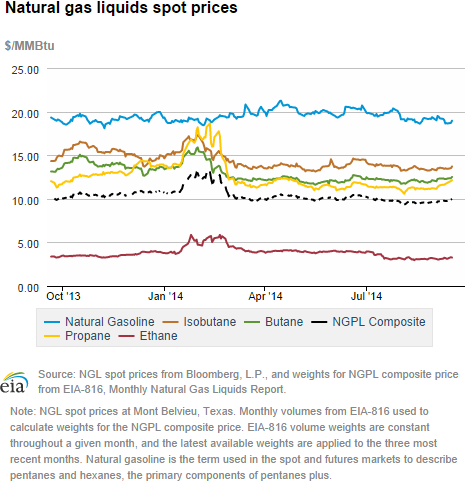
- The Mont Belvieu natural gas plant liquids composite price rose 1.9% to $9.94/MMBtu for the week covering September 15-19. The natural gasoline price remained flat while the prices of ethane, propane, butane, and Isobutane rose 3.5%, 3.2%, 1.1%, and 1.1%, respectively.
Prices/Demand/Supply:
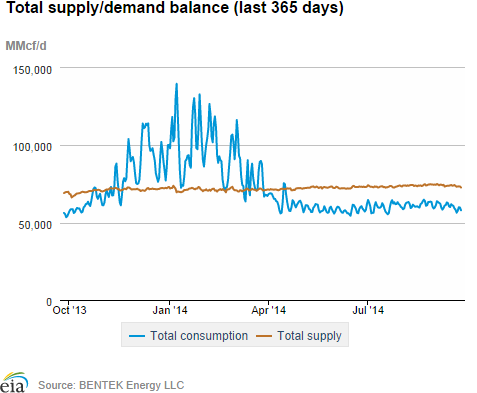
Despite some crisp mornings, gas demand falls 5%. Temperatures, nationally, remain moderate, though cooler evenings and crisp mornings have announced that fall is ahead, at least for the New England states. Natural gas consumption for the week (all sectors) was down 4.9%, and though residential/commercial demand went up as the cold came east, increasing by 14.4% on Monday, it was offset by a reduced call for power through the week. The power burn (natural gas used to fuel power plants), as reported by Bentek, showed demand falling or remaining flat for most markets, with only minor gains in the Midcontinent and Midwest. Henry Hub prices remained below $4/MMBtu as overall temperatures were mild and demand was moderate.
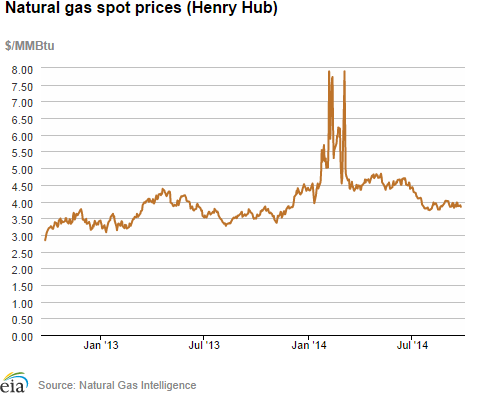
Prices fluctuate across the week, New England rises. Prices in New England rose approximately 80% over the week, from a starting point of $2.64/MMBtu on September 17, rising to $4.77 on September 24. Continuing inspections related to a DOT-mandated pipeline integrity program at AGT, requiring isolation of its 24-inch-diameter Cromwell-to-Burrillville line, are contributing to the rise in New England prices. AGT expects the investigation to continue through October 8. The rest of the markets fluctuated within a moderate range, hovering within a few cents of their weekly starting point. Transco Zone 6 (New York), however, fell significantly, moving from $2.47/MMBtu on September 17, to $1.86/MMBtu yesterday. Henry Hub spot prices started last Wednesday at $3.97/MMBtu and fell to $3.84 yesterday. Mild but cooling weather may have driven the rise in New England’s price.
Marcellus prices vary considerably. Marcellus prices varied more than 20% across the week, but remained low compared to most markets. The Marcellus trading point (Tennessee Pipeline's Zone 4) started the report week on Wednesday at $2.24/MMBtu, then fluctuated before closing the report week at $1.73/ MMBtu yesterday.
Nymex prices lower. The Nymex October contract expires at the end of trading on Friday, September 26. While the Nymex rose last week to $4.013/MMBtu on Wednesday, it edged down slowly over the week to $3.911/MMBtu yesterday, September 24. This week’s downward trend reflects moderate temperatures and high storage injection rates, but showed some response to projected cooling.
Supply down, but demand down more. Overall supply fell by 0.7% for the week ending September 24 because of reduced production and low imports. Dry gas production decreased by 1%, but remains 7.6% greater than year-ago levels. Imports from Canada increased week-over-week by 3.3%, with Northwest imports increasing and Northeast imports dropping. LNG supplied to the pipeline grid remained at minimal levels. Demand fell this week in all sectors, with overall consumption decreasing by 4.9%, although there were daily increases in demand for industrial and residential/commercial use associated with cooler temperatures.
Storage
Net injections into storage much higher than average. The net injection reported for the week ending September 19 was 97 Bcf, 18 Bcf larger than the five-year average net injection of 79 Bcf and 15 Bcf larger than last year's net injection of 82 Bcf. Working gas inventories totaled 2,988 Bcf, 386 Bcf (11.4%) less than last year at this time and 426 Bcf (12.5%) below the five-year (2009-13) average.
Storage build falls within range of expectations. Market expectations called for a build of 88-101 Bcf, with an average of 95 Bcf. When the EIA storage report was released at 10:30 a.m., the price for the October natural gas futures contract rose 3 cents to $3.88/MMBtu in trading on the Nymex.
From the week ending on April 4 through the week ending on September 19, net storage injections totaled 2,166 Bcf versus 1,674 Bcf for the same 25 weeks in 2013, and 1,600 Bcf for these weeks between 2009 and 2013, on average. The average unit value of what storage holders put into storage from April 4 to September 19 was $4.30/MMBtu, 14% higher than the average value for the same 25 weeks last year of $3.79/MMBtu. The highest winter-month Nymex price (for the January 2015 contract) in trading for the week ending on September 12 averaged $4.13/MMBtu. This is 22 cents more than the current front month Nymex contract price for that week. A year ago, the difference was 31 cents/MMBtu.
There currently are 6 more weeks in the injection season, which traditionally occurs April 1 through October 31, although in each of the past 11 years, injections continued into November. EIA forecasts that the end-of-October working natural gas inventory level will be 3,477 Bcf, which, as of September 9, would require an average injection of 82 Bcf per week through the end of October. EIA's forecast for the end-of-October inventory levels are below the five-year (2009-13) average peak storage value of 3,851 Bcf.
Two of the three regions post larger-than-average builds. The East, West, and Producing regions had net injections of 66 Bcf (15 Bcf larger than its five-year average), 0 Bcf (7 Bcf smaller than its five-year average), and 31 Bcf (9 Bcf larger than its five-year average), respectively. Storage levels for all three regions remain below their year-ago and five-year average levels.
Temperatures during the storage report week were a few degrees cooler than the 30-year average. Temperatures in the Lower 48 states averaged 65.4 degrees for the week, 2.3 degrees cooler than the 30-year normal temperature and 2.3 degrees cooler than during the same period last year. There were 38 population-weighted cooling degree days during the storage report week, 1 higher than the 30-year normal and 5 lower than the same period last year.
See also:
| Spot Prices ($/MMBtu) | Thu, 18-Sep |
Fri, 19-Sep |
Mon, 22-Sep |
Tue, 23-Sep |
Wed, 24-Sep |
|---|---|---|---|---|---|
| Henry Hub |
3.96 |
3.86 |
3.87 |
3.89 |
3.84 |
| New York |
2.11 |
1.70 |
2.07 |
1.99 |
1.86 |
| Chicago |
4.04 |
3.91 |
3.95 |
3.96 |
3.89 |
| Cal. Comp. Avg,* |
4.25 |
4.09 |
4.16 |
4.18 |
4.09 |
| Futures ($/MMBtu) | |||||
| October Contract |
3.910 |
3.837 |
3.850 |
3.816 |
3.911 |
| November Contract |
3.975 |
3.903 |
3.908 |
3.869 |
3.975 |
| *Avg. of NGI's reported prices for: Malin, PG&E citygate, and Southern California Border Avg. | |||||
| Source: NGI's Daily Gas Price Index | |||||
| U.S. Natural Gas Supply - Gas Week: (9/17/14 - 9/24/14) | ||
|---|---|---|
Percent change for week compared with: |
||
last year |
last week |
|
| Gross Production | 7.65%
|
-0.97%
|
| Dry Production | 7.58%
|
-0.96%
|
| Canadian Imports | -4.87%
|
3.26%
|
| West (Net) | -16.35%
|
4.97%
|
| MidWest (Net) | 23.15%
|
-0.03%
|
| Northeast (Net) | 562.84%
|
-10.96%
|
| LNG Imports | -67.29%
|
3.02%
|
| Total Supply | 6.40%
|
-0.69%
|
| Source: BENTEK Energy LLC | ||
| U.S. Consumption - Gas Week: (9/17/14 - 9/24/14) | ||
|---|---|---|
Percent change for week compared with: |
||
last year |
last week |
|
| U.S. Consumption | 3.4%
|
-4.9%
|
| Power | 4.9%
|
-4.6%
|
| Industrial | 2.5%
|
-0.4%
|
| Residential/Commercial | 2.2%
|
-11.5%
|
| Total Demand | 3.7%
|
-4.9%
|
| Source: BENTEK Energy LLC | ||
| Rigs | |||
|---|---|---|---|
Fri, September 19, 2014 |
Change from |
||
last week |
last year |
||
| Oil Rigs | 1,601 |
0.57% |
16.95% |
| Natural Gas Rigs | 329 |
-2.66% |
-14.77% |
| Miscellaneous | 1 |
0.00% |
-83.33% |
| Rig Numbers by Type | |||
|---|---|---|---|
Fri, September 19, 2014 |
Change from |
||
last week |
last year |
||
| Vertical | 378 |
1.61% |
-10.21% |
| Horizontal | 1,341 |
-0.07% |
22.91% |
| Directional | 212 |
-2.30% |
-14.86% |
| Source: Baker Hughes Inc. | |||
| Working Gas in Underground Storage | ||||
|---|---|---|---|---|
Stocks billion cubic feet (bcf) |
||||
| Region | 2014-09-19 |
2014-09-12 |
change |
|
| East | 1,646 |
1,580 |
66 |
|
| West | 445 |
445 |
0 |
|
| Producing | 897 |
866 |
31 |
|
| Total | 2,988 |
2,891 |
97 |
|
| Source: U.S. Energy Information Administration | ||||
| Working Gas in Underground Storage | |||||
|---|---|---|---|---|---|
Historical Comparisons |
|||||
Year ago (9/19/13) |
5-year average (2009-2013) |
||||
| Region | Stocks (Bcf) |
% change |
Stocks (Bcf) |
% change |
|
| East | 1,734 |
-5.1 |
1,836 |
-10.3 |
|
| West | 518 |
-14.1 |
489 |
-9.0 |
|
| Producing | 1,121 |
-20.0 |
1,089 |
-17.6 |
|
| Total | 3,374 |
-11.4 |
3,414 |
-12.5 |
|
| Source: U.S. Energy Information Administration | |||||
| Temperature -- Heating & Cooling Degree Days (week ending Sep 18) | ||||||||
|---|---|---|---|---|---|---|---|---|
HDD deviation from: |
CDD deviation from: |
|||||||
| Region | HDD Current |
normal |
last year |
CDD Current |
normal |
last year |
||
| New England | 54
|
26
|
11
|
0
|
-4
|
-13
|
||
| Middle Atlantic | 38
|
18
|
-3
|
0
|
-13
|
-10
|
||
| E N Central | 73
|
47
|
27
|
0
|
-14
|
-7
|
||
| W N Central | 70
|
40
|
39
|
2
|
-17
|
-16
|
||
| South Atlantic | 7
|
2
|
-6
|
65
|
3
|
1
|
||
| E S Central | 11
|
6
|
5
|
48
|
-2
|
-7
|
||
| W S Central | 6
|
4
|
6
|
72
|
-10
|
-40
|
||
| Mountain | 26
|
-8
|
16
|
50
|
10
|
-4
|
||
| Pacific | 2
|
-10
|
-1
|
74
|
43
|
29
|
||
| United States | 35
|
17
|
11
|
38
|
1
|
-5
|
||
|
Note: HDD = heating degree-day; CDD = cooling degree-day Source: National Oceanic and Atmospheric Administration | ||||||||
Average temperature (°F)
7-Day Mean ending Sep 18, 2014
Source: NOAA/National Weather Service
Deviation between average and normal (°F)
7-Day Mean ending Sep 18, 2014
Source: NOAA/National Weather Service