In the News:
Colder-than-normal eastern winter leads to record natural gas storage withdrawals
This winter's natural gas withdrawal season (generally considered to be from the beginning of November to the end of March) saw the largest storage withdrawal on record (since 1994-95). Historically, winter stock withdrawals average around 2 trillion cubic feet (Tcf). However, this winter much of the country experienced sustained colder-than-normal temperatures, and almost 3 Tcf of gas has been withdrawn from storage as of the end of March.
Most of the country east of the Rockies experienced a significantly colder-than-normal winter this year, with the Midwest having a particularly cold and snowy winter. From Minnesota to Michigan and down to Missouri, on a statewide basis, this December-through-February period was between the 5th and 10th coldest on record. The cold weather increased demand for propane for space heating, straining a market that was already tight because of increased demand for crop drying in November, leading to Midwest propane price spikes.
Chicago recorded its coldest winter (December to March) on record (since 1872). Heating degree days, a measure of how much and for how long that temperatures drop below 65 degrees Fahrenheit, were more than 20% above (meaning colder than) the 5-year average in Chicago this winter. Natural gas prices at the Chicago Citygate normally trade at a premium of 10 cents to 20 cents versus prices at the Henry Hub in Louisiana. However, between the beginning of December and the end of March this differential averaged more than $3 per million British thermal units (MMBtu). In January and February, repeated price spikes resulted in an average differential to Henry Hub of $5.42/MMBtu.
As with much of the country, the cold was record-setting more for its sustained nature than for any single month. While the December to March period as a whole was the coldest on record in Chicago, the months December, January, February, and March individually ranked as the 21st, 10th, 9th, and 19th coldest on record, respectively. Additionally, while it doesn't necessarily affect heating demand, this winter has also been unusually snowy in the Midwest, as well as across much of the country east of the Rockies. From December to March, Chicago recorded 79.7 inches of snow, 46.0 inches more than the normal of 33.7 inches for the period.
East of the Rockies, but outside the Midwest, this winter was also colder than normal, although not as record-breaking as in the Midwest. In the Northeast, heating degree days in the high population areas of Boston and New York City this winter were more than 10% above the 5-year average. However, on a statewide basis, temperatures in the December through March period did not even rank in the top 50 coldest for many states in the Northeast. Across the South, heating degree days in Dallas were around 20% higher than the 5-year average this winter, and were 10% higher than normal in Atlanta. Atlanta also experienced higher-than-normal snowfall, recording 4.6 inches from December through February, more than twice the average of 2.1 inches.
The weather this winter in most of the West and the Southwest was just the opposite of the rest of the country, with warmer-than-normal temperatures and less precipitation than usual. Heating degree days in Seattle and Los Angeles this winter were below the 5-year average by 6% and 29%, respectively. California experienced its warmest winter on record, while Arizona had its 4th warmest on record since 1895-96. For the current water year (since July 1), Los Angeles has recorded only 4 to 6 inches of precipitation, more than 8 inches of rain below normal.
Overview:
(For the Week Ending Wednesday, April 9, 2014)
- Spot prices rose slightly at most hubs for the report week (Wednesday, April 2, to Wednesday, April 9) and went up significantly at the benchmark Henry Hub, following declines the previous week. The Henry Hub spot price rose from $4.35/MMBtu last Wednesday to $4.66/MMBtu yesterday.
- At the New York Mercantile Exchange (Nymex), the May 2014 contract increased from $4.364/MMBtu on Wednesday to $4.586/MMBtu yesterday.
- Working natural gas in storage rose to 826 billion cubic feet (Bcf) as of Friday, April 4, according to the U.S. Energy Information Administration (EIA) Weekly Natural Gas Storage Report (WNGSR). A net storage injection of 4 Bcf for the week resulted in storage levels 50.7% below year-ago levels and 54.7% below the 5-year average.
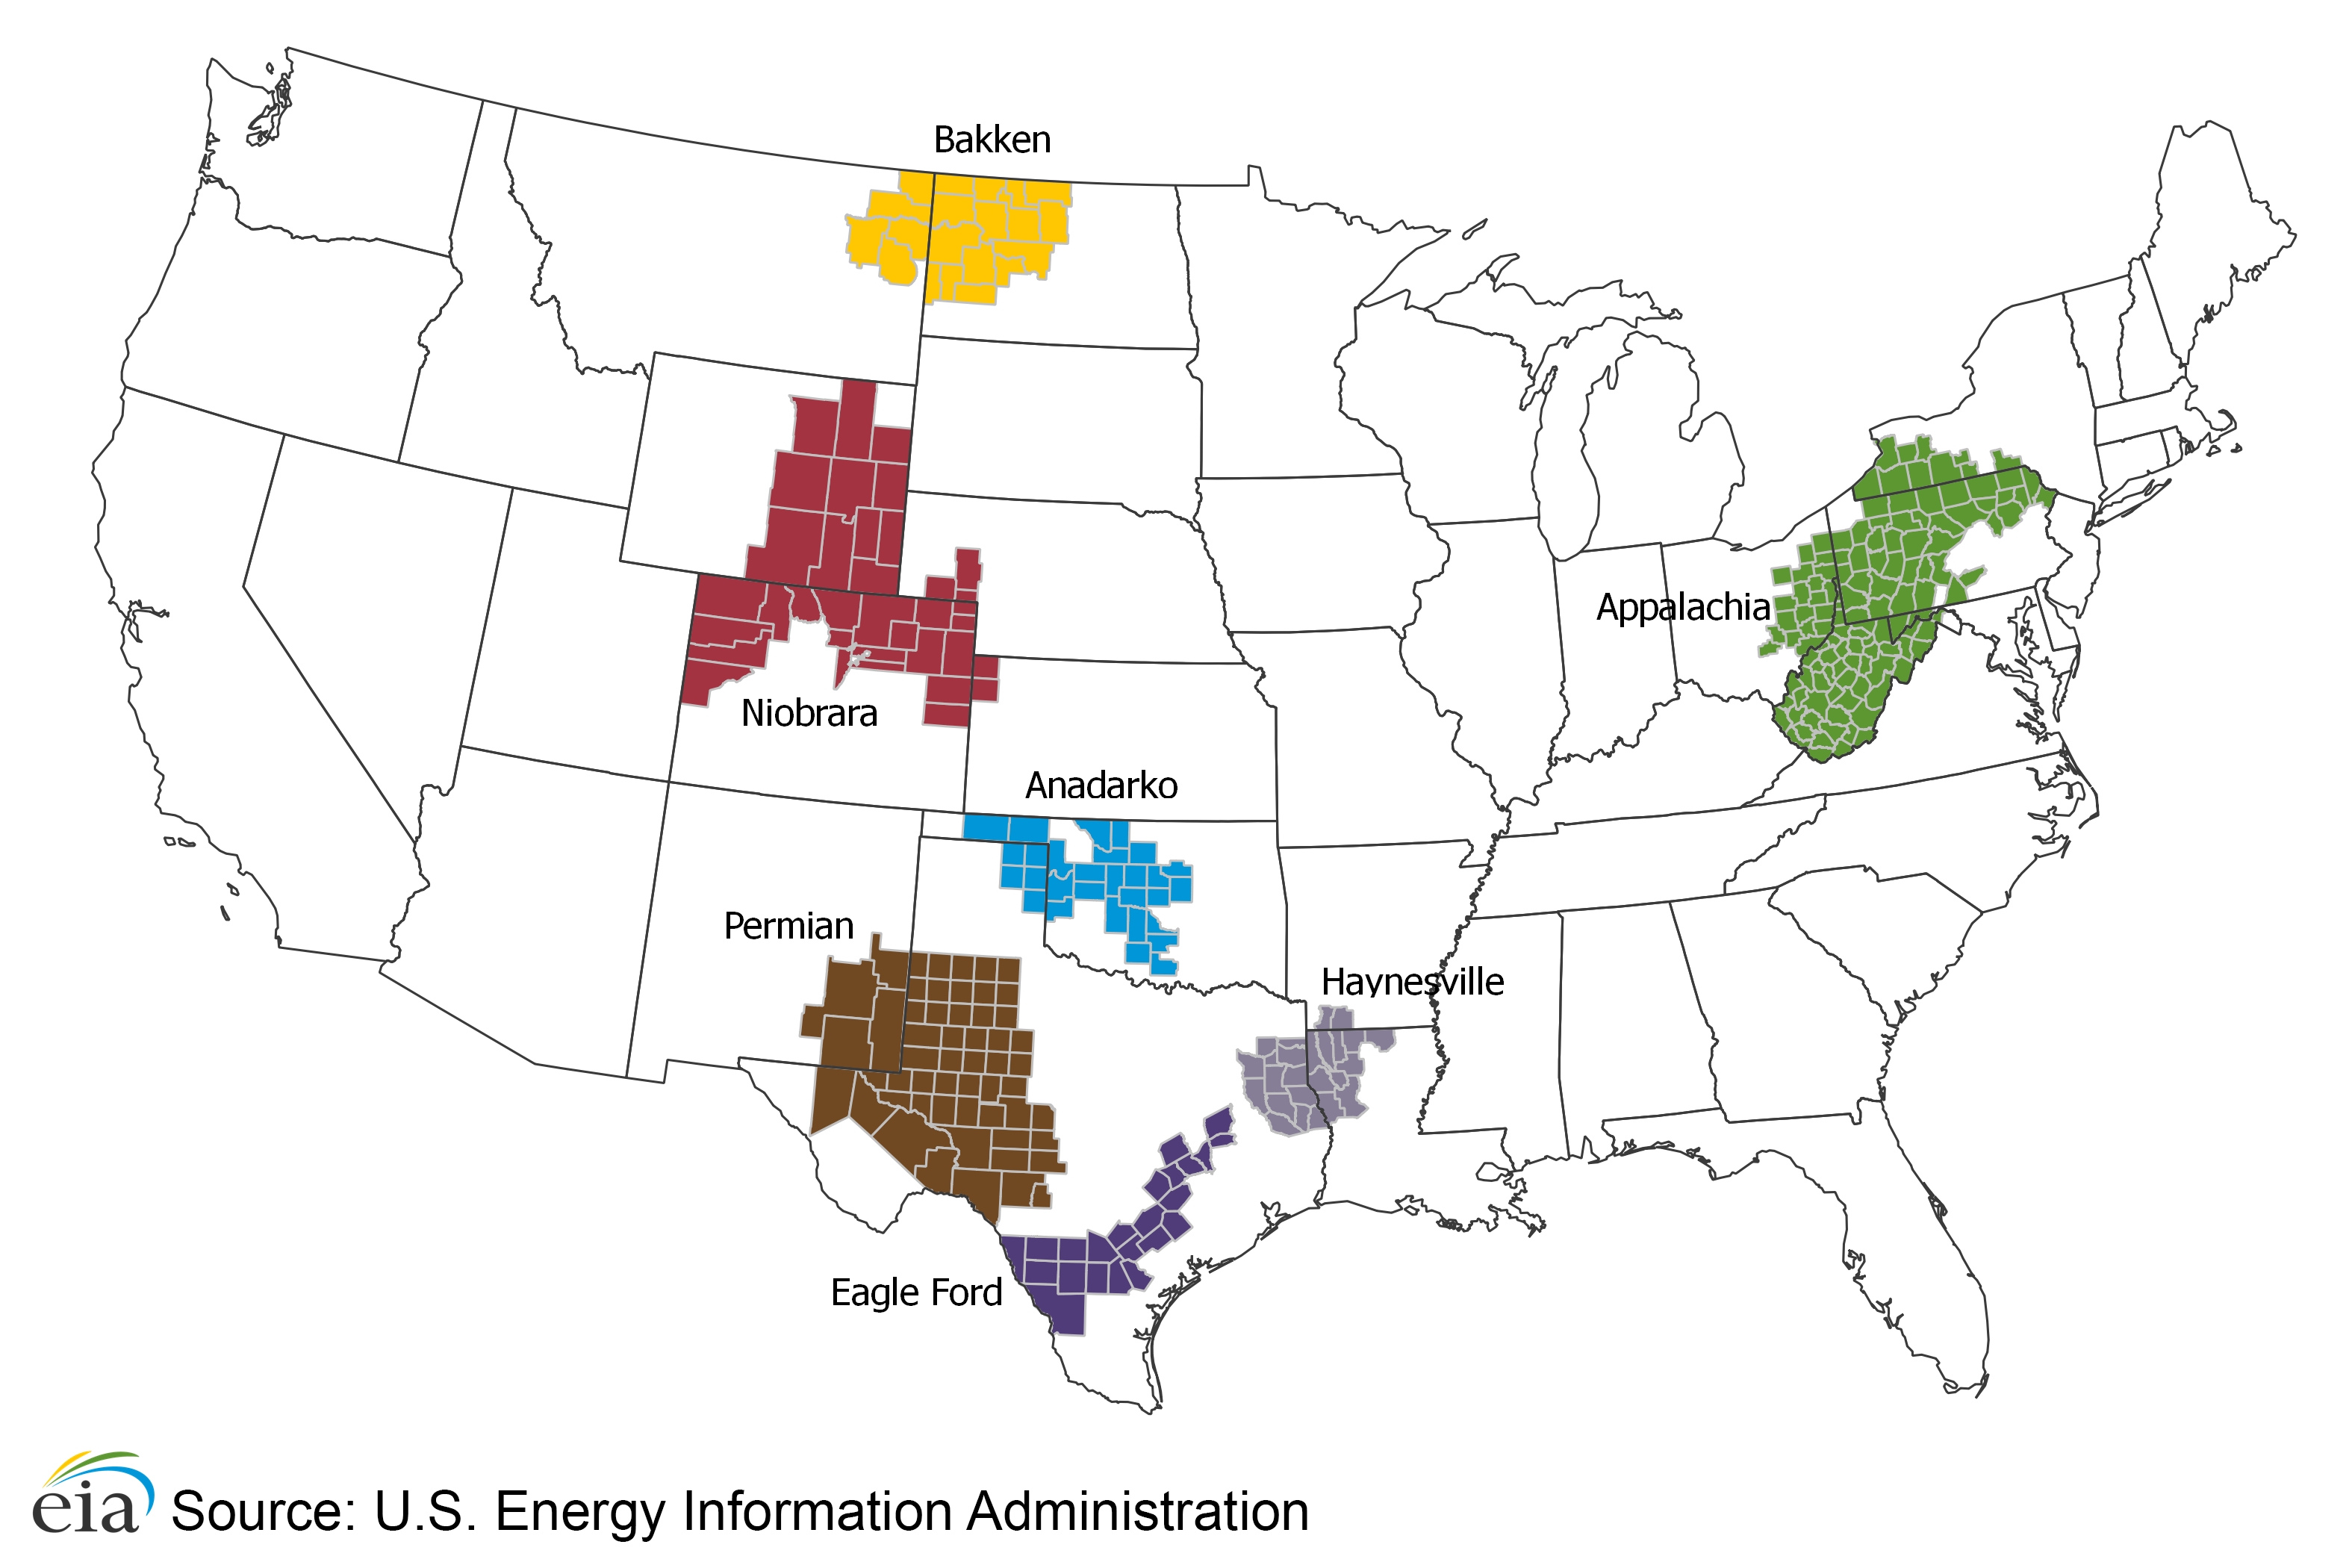
- The total rig count was 1,818 as of April 4, an increase of 9 from the previous week, according to data from Baker Hughes Inc. The natural gas rig count decreased by 2 rigs to 316, while the number of oil-directed rigs rose by 11 to 1,498. Since the beginning of 2014, the gas-directed rig count has decreased by 56, with the biggest declines at the Eagle Ford Shale in South Texas (-15), and the Woodford Shale in Oklahoma and Texas (--10). The oil-directed rig count increased by 120, with biggest increases at the Permian Basin in West Texas and eastern New Mexico (61), and the Eagle Ford (11).
- A 2% rise in the price of propane, from $11.48/MMBtu to $11.71/MMBtu, caused the weekly average natural gas plant liquids composite price to increase for the second week in a row. The composite price rose this week (covering March 31 through April 4) by 0.2%, and is now at $9.94/MMBtu. The propane price increase alone drove up the composite price, as prices decreased for ethane (1.3%), butane (0.7%), isobutane (1.0%) and natural gasoline (0.7%).
Prices/Demand/Supply:
Henry Hub price rises. The Henry Hub spot price rose by 31 cents/MMBtu this week, to $4.66/MMBtu yesterday. Temperatures warmed this week in most of the United States, contributing to price increases that were less pronounced than those seen at Henry Hub. Prices rose slightly at most major markets, with the exception of Boston and Chicago, where spot prices decreased slightly.
Nymex prices increase 22 cents. After decreasing slightly last week, the Nymex May contract rose this week, from $4.364/MMBtu on Wednesday, April 2, to $4.586/MMBtu yesterday. The 12-month strip (the 12 contracts between May 2014 and April 2015) rose slightly, from $4.454/MMBtu last Wednesday to $4.624/MMBtu yesterday.
Consumption decreases week over week. Warmer temperatures this week contributed to a 4.1% week-on-week decline in total consumption, from an average of 67.5 billion cubic feet per day (Bcf/d) last week to 64.8 Bcf/d this week. This was the second week in a row that consumption decreased, and the lowest weekly average since the beginning of November 2013.
For the first time in 2014, residential/commercial consumption decreased while power sector consumption (power burn) increased. Residential/commercial consumption and power burn generally move in tandem during winter months (November to March), when homes, businesses and electric generators mainly consume natural gas in response to space heating demand. However, as temperatures warm, power burn largely responds to demand for cooling and air conditioning.
Power burn peaked this week at 18.5 Bcf on Tuesday, when the average temperature in the contiguous United States also peaked at 57 degrees, and rose for the report week by 0.9 Bcf/d, or 6%. Warmer temperatures contributed to increased week-on-week power burn in the Southeast (0.6 Bcf/d, 11%), Midwest (0.3 Bcf/d, 44%), Southwest (0.2 Bcf/d, 7%), and Midcontinent (0.1 Bcf/d, 24%), while cooler temperatures in Texas contributed to a 0.2 Bcf/d (6%) decrease there in power burn. This week's 0.9 Bcf/d rise in power burn only partially offset a 3.1 Bcf/d (11%) decrease in residential/commercial consumption. Industrial consumption also declined, by 0.5 Bcf/d (2%), and net exports to Mexico declined by 0.1 Bcf/d (7%).
Increased U.S. net imports push up total supply. Net natural gas imports from Canada increased this week by 0.4 Bcf/d (9%), driving a 0.3 Bcf/d increase in total natural gas supply. Imports from Canada into the West and Midwest both increased, while imports from Canada into the Northeast decreased. A 0.1 Bcf/d decrease in dry natural gas production to 67.2 Bcf/d, from last week's 2014 peak of 67.3 Bcf/d, partially offset the increase in net imports from Canada.
Storage
Warmer weather brings a smaller-than-average net injection. The net injection reported for the week ending April 4 was 4 Bcf, 5 Bcf smaller than the 5-year average net injection of 9 Bcf but larger than last year's net withdrawal of 25 Bcf. Working gas inventories totaled 826 Bcf, 849 Bcf (50.7%) less than last year at this time, 997 Bcf (54.7%) below the 5-year (2009-13) average, and 765 Bcf (48.1%) below the 5-year observed minimum.
Storage build was significantly smaller than market expectations of 14 Bcf. When the EIA storage report was released at 10:30 a.m., the price for the April natural gas futures contract rose 14 cents to $4.67/MMBtu on the Nymex. Prices rose another 1 cent in the hour following the release.
One of the three regions posted a smaller-than-average build. The Producing region had a net injection of 9 Bcf (1 Bcf smaller than its 5-year average injection of 10 Bcf) while the West region showed no change for the week (compared with its 5-year average injection of 3 Bcf). The East region had a net withdrawal of 5 Bcf (the same as its 5-year average withdrawal). Storage levels for all three regions remain below their year-ago and 5-year average levels, and their 5-year minimums.
Temperatures during the storage report week warmer than normal. Temperatures in the Lower 48 states averaged 49.0 degrees for the week, 0.3 degree warmer than the 30-year normal temperature and 1.6 degrees warmer than during the same period last year.
See also:


| Spot Prices ($/MMBtu) | Thu, 03-Apr |
Fri, 04-Apr |
Mon, 07-Apr |
Tue, 08-Apr |
Wed, 09-Apr |
|---|---|---|---|---|---|
| Henry Hub |
4.48 |
4.48 |
4.55 |
4.56 |
4.66 |
| New York |
4.42 |
4.31 |
4.47 |
4.59 |
4.49 |
| Chicago |
4.76 |
4.68 |
4.69 |
4.67 |
4.65 |
| Cal. Comp. Avg,* |
4.72 |
4.67 |
4.74 |
4.72 |
4.78 |
| Futures ($/MMBtu) | |||||
| May Contract |
4.470 |
4.439 |
4.476 |
4.534 |
4.586 |
| June Contract |
4.499 |
4.467 |
4.502 |
4.550 |
4.593 |
| *Avg. of NGI's reported prices for: Malin, PG&E citygate, and Southern California Border Avg. | |||||
| Source: NGI's Daily Gas Price Index | |||||


| U.S. Natural Gas Supply - Gas Week: (4/2/14 - 4/9/14) | ||
|---|---|---|
Percent change for week compared with: |
||
last year |
last week |
|
| Gross Production | 4.22%
|
-0.13%
|
| Dry Production | 4.17%
|
-0.13%
|
| Canadian Imports | -9.85%
|
9.49%
|
| West (Net) | 3.42%
|
22.25%
|
| MidWest (Net) | -26.66%
|
9.20%
|
| Northeast (Net) | 17.78%
|
-35.79%
|
| LNG Imports | -43.60%
|
0.59%
|
| Total Supply | 3.07%
|
0.40%
|
| Source: BENTEK Energy LLC | ||
| U.S. Consumption - Gas Week: (4/2/14 - 4/9/14) | ||
|---|---|---|
Percent change for week compared with: |
||
last year |
last week |
|
| U.S. Consumption | -0.8%
|
-4.1%
|
| Power | -6.2%
|
5.5%
|
| Industrial | 1.6%
|
-2.4%
|
| Residential/Commercial | 1.4%
|
-10.8%
|
| Total Demand | -0.8%
|
-4.1%
|
| Source: BENTEK Energy LLC | ||


| Rigs | |||
|---|---|---|---|
Fri, April 04, 2014 |
Change from |
||
last week |
last year |
||
| Oil Rigs | 1,498 |
0.74% |
10.39% |
| Natural Gas Rigs | 316 |
-0.63% |
-15.73% |
| Miscellaneous | 4 |
0.00% |
-33.33% |
| Rig Numbers by Type | |||
|---|---|---|---|
Fri, April 04, 2014 |
Change from |
||
last week |
last year |
||
| Vertical | 393 |
2.34% |
-12.86% |
| Horizontal | 1,224 |
1.07% |
12.92% |
| Directional | 201 |
-6.07% |
-0.99% |
| Source: Baker Hughes Inc. | |||
| Working Gas in Underground Storage | ||||
|---|---|---|---|---|
Stocks billion cubic feet (bcf) |
||||
| Region | 2014-04-04 |
2014-03-28 |
change |
|
| East | 305 |
310 |
-5 |
|
| West | 160 |
160 |
0 |
|
| Producing | 361 |
352 |
9 |
|
| Total | 826 |
822 |
4 |
|
| Source: U.S. Energy Information Administration | ||||
| Working Gas in Underground Storage | |||||
|---|---|---|---|---|---|
Historical Comparisons |
|||||
Year ago (4/4/13) |
5-year average (2009-2013) |
||||
| Region | Stocks (Bcf) |
% change |
Stocks (Bcf) |
% change |
|
| East | 648 |
-52.9 |
753 |
-59.5 |
|
| West | 336 |
-52.4 |
297 |
-46.1 |
|
| Producing | 691 |
-47.8 |
772 |
-53.2 |
|
| Total | 1,675 |
-50.7 |
1,823 |
-54.7 |
|
| Source: U.S. Energy Information Administration | |||||
| Temperature -- Heating & Cooling Degree Days (week ending Apr 03) | ||||||||
|---|---|---|---|---|---|---|---|---|
HDD deviation from: |
CDD deviation from: |
|||||||
| Region | HDD Current |
normal |
last year |
CDD Current |
normal |
last year |
||
| New England | 168
|
1
|
0
|
0
|
0
|
0
|
||
| Middle Atlantic | 145
|
-7
|
-25
|
0
|
0
|
0
|
||
| E N Central | 161
|
3
|
-29
|
0
|
0
|
0
|
||
| W N Central | 169
|
16
|
-8
|
0
|
-1
|
0
|
||
| South Atlantic | 71
|
-11
|
-33
|
12
|
-1
|
3
|
||
| E S Central | 59
|
-18
|
-48
|
3
|
-2
|
3
|
||
| W S Central | 22
|
-19
|
-19
|
31
|
17
|
13
|
||
| Mountain | 128
|
-7
|
31
|
1
|
-4
|
-6
|
||
| Pacific | 93
|
13
|
43
|
0
|
-2
|
0
|
||
| United States | 118
|
-1
|
-9
|
6
|
1
|
2
|
||
|
Note: HDD = heating degree-day; CDD = cooling degree-day Source: National Oceanic and Atmospheric Administration | ||||||||
Average temperature (°F)
7-Day Mean ending Apr 03, 2014

Source: NOAA/National Weather Service
Deviation between average and normal (°F)
7-Day Mean ending Apr 03, 2014
Source: NOAA/National Weather Service
