In the News:
Natural gas consumption sets winter record, with residential/commercial sectors surpassing 50% share
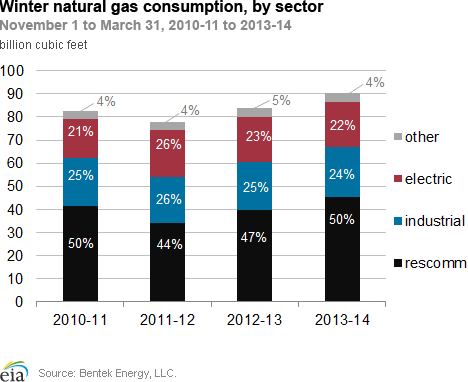
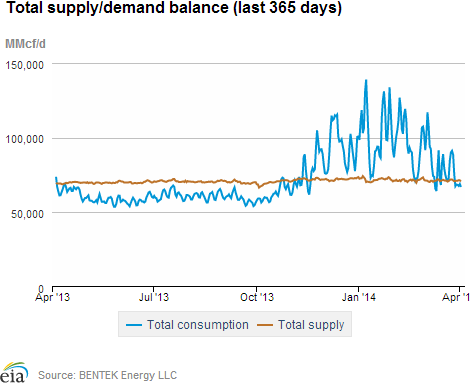
Total natural gas consumption in the United States rose to a record average of 90.6 billion cubic feet per day (Bcf/d) this winter, according to data from Bentek Energy. Cold weather drove total consumption up by 8% over last winter's levels, despite higher prices. Increases occurred in all major natural gas sectors, but particularly among residential and commercial consumers, whose combined consumption rose to more than half of total U.S. consumption this winter.
Natural gas consumption also rose in the electric and industrial sectors, but to a lesser degree than in the residential and commercial sectors. This was largely because power generators' and industrial customers' consumption of natural gas is less sensitive to weather and more sensitive to price than is consumption from homes and businesses.
Residential and commercial consumption
The contiguous United States saw a daily average of 23.5 heating degree days (HDDs, the variation of temperatures below 65 degrees Fahrenheit) this winter, 13% more than the average for both last winter and the previous five winters. Residential and commercial consumers increased their consumption to a greater degree in response to these colder temperatures than consumers in other sectors, as most of the natural gas consumed by homes and businesses directly involves space heating. This made the residential and commercial sectors less likely to curtail consumption when prices rose to more than $5.00/MMBtu on days between the end of January and the beginning of March. Residential and commercial consumption rose by 14% this winter, driving their share of total U.S. consumption to more than 50% for the first time since the 2010-11 winter season.
Industrial sector consumption
Prolonged periods of bitterly cold temperatures this winter also contributed to higher levels of industrial sector consumption, because large industrial facilities needed additional gas for space heating. However, since like electric generators, industrial customers more frequently purchase natural gas with spot and futures contracts whose prices fluctuate daily, this winter's 33% price increase limited industrial consumption growth, which rose by only 2%, to 21.5 Bcf/d. As a result, the industrial sector's share of total U.S. natural gas consumption decreased to 24% this winter, from 25% last winter and 26% during the 2011-12 winter season.
Electric sector consumption
Similarly, increased natural gas prices limited the degree to which consumption from electric generators (power burn) rose to meet higher electric demand this winter. Although power burn grew throughout most of the United States as cold temperatures led to increased electric demand for space heating, it decreased in the Northeast and Southeast. Markets in these regions responded to higher gas prices by increasing electric generation from other power sources, such as nuclear, hydroelectric, wind, and coal, or decreasing total electric generation. As a result, power burn rose by only 1% this winter, to 19.7 Bcf/d, and its share of total U.S. natural gas consumption declined to 22% this winter versus 23% last winter and 26% during the 2011-12 winter season.
Overview:
(For the Week Ending Wednesday, April 2, 2014)
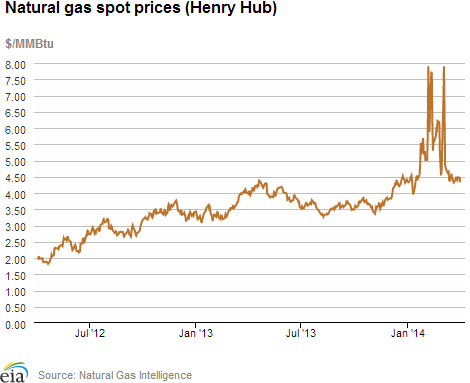
- Spot prices fell at most market locations during the report week (Wednesday, March 26, to Wednesday, April 2). The Henry Hub spot price fell from $4.42/MMBtu last Wednesday to $4.35/MMBtu yesterday.
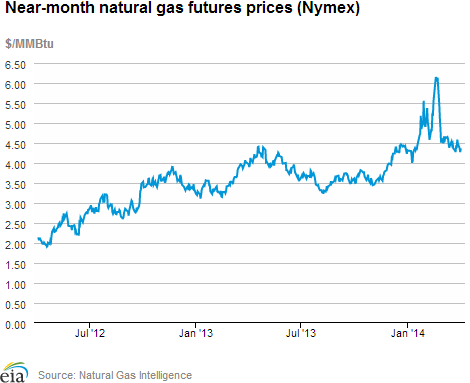
- At the New York Mercantile Exchange (Nymex), the May 2014 contract decreased slightly from $4.395/MMBtu at the beginning of the report week to $4.364/MMBtu yesterday.
- Working natural gas in storage fell to 822 billion cubic feet (Bcf) as of Friday, March 28, according to the U.S. Energy Information Administration (EIA) Weekly Natural Gas Storage Report (WNGSR). A net storage withdrawal of 74 Bcf for the week resulted in storage levels 51.6% below year-ago levels and 54.7% below the 5-year average.
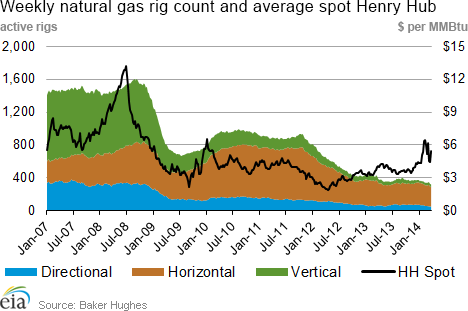
- The total rig count was 1,809 as of March 28, according to data from Baker Hughes Inc., an increase of 6 from the previous week. The natural gas rotary rig count totaled 318, which represents a decrease of 8 rigs from the previous week and a decrease of 71 units from the same time last year. Oil rigs rose for the seventh week in a row, by 14 units to 1,487, which is 133 greater than last year at this time.
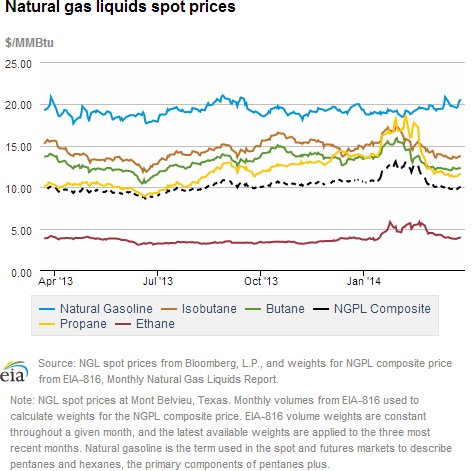
- The weekly average natural gas plant liquids composite price, after seven weeks of declines, increased this week (covering March 24 through March 28) by 0.7%, and is now at $9.92/MMBtu. This is still more than $2.75/MMBtu less than at the end of January, when the composite price was $12.69/MMBtu. Butane and isobutane prices increased by 1.0% and 1.2%, respectively, and natural gasoline prices rose 0.8%. Propane prices increased by 0.7%, while the price of ethane increased by 0.2%.
Prices/Demand/Supply:
Henry Hub price falls. The Henry Hub spot price declined to $4.35/MMBtu this week, despite snow falling across much of the Midwest and Northeast in the last days of March. Price patterns were similar in most other parts of the country, as temperatures toward the end of the report week finally seem to be moderating after a winter characterized by frigid temperatures and near record-breaking snowfalls in several major cities.
Northeast prices increase Monday, following significant declines last Thursday. Spot prices in the Northeast closed lower at most major trading hubs this Wednesday versus last Wednesday. The natural gas spot price at the Algonquin Citygate hub serving Boston-area consumers fell by $2.08/MMBtu last Thursday, but then rose $1.26/MMBtu on Monday as temperatures fluctuated over the week. It closed yesterday at $5.17/MMBtu, down $1.91/MMBtu from last Wednesday. Spot prices at other Northeast hubs followed a similar pattern, but with generally more moderate price movements from day to day and from Wednesday to Wednesday.
Nymex prices decrease slightly. The Nymex May contract, which became the near-month contract on Friday, opened the report week at $4.395/MMBtu last Wednesday and settled yesterday at $4.364/MMBtu. The 12-month strip (the 12 contracts between May 2014 and April 2014) fell slightly from $4.502/MMBtu last Wednesday to $4.454/MMBtu yesterday.
Consumption decreases week over week. Total consumption decreased 15.8% week over week, as temperatures moderated, with decreases occurring in all sectors. The largest decline was in the residential and commercial sectors, which primarily use natural gas for heating. Residential and commercial consumption declined 25.6% this week. Consumption of natural gas for power generation decreased 10.5%, and industrial consumption declined 2.5%.
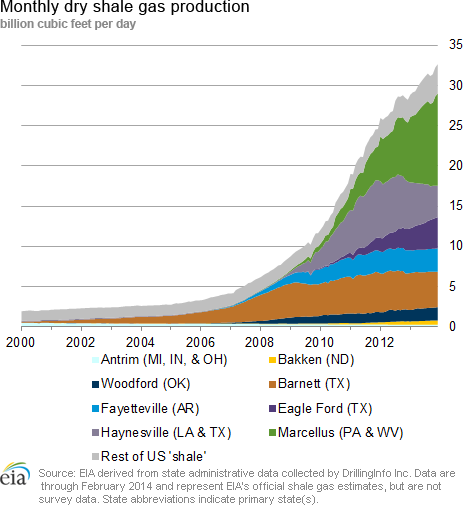
Decreased U.S. net imports push down total supply. Total supply decreased 0.4% this week, according to data from Bentek Energy. Natural gas dry production in the United States increased for the fourth week in a row, by 0.4%, to 67.2 Bcf/d. However, the 0.2 Bcf/d increase in U.S. dry production this week only partially offset a 0.5 Bcf/d (11.9%) decrease in net natural gas pipeline imports from Canada. Imports into the Northeast, Midwest, and West all decreased, with the largest decline seen in the Northeast where net imports from Canada fell 0.3 Bcf/d (38.9%). Net natural gas pipeline imports from Canada into the Midwest and West each fell 0.1 Bcf/d (6.5% and 4.8%, respectively).
Storage
Cooler weather brings a larger-than-average net withdrawal. The net withdrawal reported for the week ending March 28 was 74 Bcf, 66 Bcf larger than the 5-year average net withdrawal of 8 Bcf but 21 Bcf smaller than last year's net withdrawal of 95 Bcf. Working gas inventories totaled 822 Bcf, 878 Bcf (51.6%) less than last year at this time, 992 Bcf (54.7%) below the 5-year (2009-13) average, and 783 Bcf (48.8%) below the 5-year minimum.
Storage draw is the same as market expectations of 74 Bcf. When the EIA storage report was released at 10:30 a.m., the price for the April natural gas futures contract fell 2 cents to $4.38/MMBtu on the Nymex. Prices rose 1 cent in the hour following the release.
All three regions posted larger-than-average withdrawal. The East, West, and Producing regions had net withdrawals of 46 Bcf (29 Bcf larger than its 5-year average withdrawal of 17 Bcf), 4 Bcf (compared with its 5-year average injection of 1 Bcf), and 24 Bcf (compared with its 5-year average injection of 8 Bcf), respectively. Storage levels for all three regions remain below their year-ago and 5-year average levels, and their 5-year minimums.
Temperatures during the storage report week cooler than normal. Temperatures in the Lower 48 states averaged 41.3 degrees for the week, 5.7 degrees cooler than the 30-year normal temperature, but 1.3 degrees warmer than during the same period last year.
See also:
| Spot Prices ($/MMBtu) | Thu, 27-Mar |
Fri, 28-Mar |
Mon, 31-Mar |
Tue, 01-Apr |
Wed, 02-Apr |
|---|---|---|---|---|---|
| Henry Hub |
4.39 |
4.48 |
4.47 |
4.35 |
4.35 |
| New York |
4.31 |
4.18 |
4.31 |
4.37 |
4.34 |
| Chicago |
4.63 |
4.63 |
4.67 |
4.67 |
4.70 |
| Cal. Comp. Avg,* |
4.67 |
4.70 |
4.68 |
4.66 |
4.64 |
| Futures ($/MMBtu) | |||||
| May Contract |
4.584 |
4.485 |
4.371 |
4.276 |
4.364 |
| June Contract |
4.538 |
4.519 |
4.404 |
4.309 |
4.396 |
| *Avg. of NGI's reported prices for: Malin, PG&E citygate, and Southern California Border Avg. | |||||
| Source: NGI's Daily Gas Price Index | |||||
| U.S. Natural Gas Supply - Gas Week: (3/26/14 - 4/2/14) | ||
|---|---|---|
Percent change for week compared with: |
||
last year |
last week |
|
| Gross Production | 4.02%
|
0.36%
|
| Dry Production | 3.98%
|
0.36%
|
| Canadian Imports | -19.45%
|
-11.90%
|
| West (Net) | -25.26%
|
-4.78%
|
| MidWest (Net) | -15.41%
|
-6.50%
|
| Northeast (Net) | -5.74%
|
-38.94%
|
| LNG Imports | -85.35%
|
-24.40%
|
| Total Supply | 2.00%
|
-0.42%
|
| Source: BENTEK Energy LLC | ||
| U.S. Consumption - Gas Week: (3/26/14 - 4/2/14) | ||
|---|---|---|
Percent change for week compared with: |
||
last year |
last week |
|
| U.S. Consumption | -4.4%
|
-15.8%
|
| Power | -10.7%
|
-10.5%
|
| Industrial | 2.0%
|
-2.5%
|
| Residential/Commercial | -4.8%
|
-25.6%
|
| Total Demand | -4.0%
|
-15.3%
|
| Source: BENTEK Energy LLC | ||
| Rigs | |||
|---|---|---|---|
Fri, March 28, 2014 |
Change from |
||
last week |
last year |
||
| Oil Rigs | 1,487 |
0.95% |
9.82% |
| Natural Gas Rigs | 318 |
-2.45% |
-18.25% |
| Miscellaneous | 4 |
0.00% |
-20.00% |
| Rig Numbers by Type | |||
|---|---|---|---|
Fri, March 28, 2014 |
Change from |
||
last week |
last year |
||
| Vertical | 384 |
0.00% |
-13.32% |
| Horizontal | 1,211 |
0.41% |
10.19% |
| Directional | 214 |
0.47% |
3.88% |
| Source: Baker Hughes Inc. | |||
| Working Gas in Underground Storage | ||||
|---|---|---|---|---|
Stocks billion cubic feet (bcf) |
||||
| Region | 2014-03-28 |
2014-03-21 |
change |
|
| East | 310 |
356 |
-46 |
|
| West | 160 |
164 |
-4 |
|
| Producing | 352 |
376 |
-24 |
|
| Total | 822 |
896 |
-74 |
|
| Source: U.S. Energy Information Administration | ||||
| Working Gas in Underground Storage | |||||
|---|---|---|---|---|---|
Historical Comparisons |
|||||
Year ago (3/28/13) |
5-year average (2009-2013) |
||||
| Region | Stocks (Bcf) |
% change |
Stocks (Bcf) |
% change |
|
| East | 669 |
-53.7 |
758 |
-59.1 |
|
| West | 331 |
-51.7 |
294 |
-45.6 |
|
| Producing | 701 |
-49.8 |
762 |
-53.8 |
|
| Total | 1,700 |
-51.6 |
1,814 |
-54.7 |
|
| Source: U.S. Energy Information Administration | |||||
| Temperature -- Heating & Cooling Degree Days (week ending Mar 27) | ||||||||
|---|---|---|---|---|---|---|---|---|
HDD deviation from: |
CDD deviation from: |
|||||||
| Region | HDD Current |
normal |
last year |
CDD Current |
normal |
last year |
||
| New England | 239
|
56
|
33
|
0
|
0
|
0
|
||
| Middle Atlantic | 227
|
60
|
19
|
0
|
0
|
0
|
||
| E N Central | 243
|
68
|
5
|
0
|
0
|
0
|
||
| W N Central | 236
|
64
|
-24
|
0
|
-1
|
0
|
||
| South Atlantic | 139
|
45
|
-27
|
10
|
-2
|
2
|
||
| E S Central | 132
|
43
|
-38
|
0
|
-5
|
0
|
||
| W S Central | 67
|
17
|
-33
|
7
|
-6
|
1
|
||
| Mountain | 136
|
-9
|
-40
|
3
|
0
|
1
|
||
| Pacific | 70
|
-14
|
-1
|
0
|
-1
|
0
|
||
| United States | 169
|
38
|
-8
|
3
|
-2
|
1
|
||
|
Note: HDD = heating degree-day; CDD = cooling degree-day Source: National Oceanic and Atmospheric Administration | ||||||||
Average temperature (°F)
7-Day Mean ending Mar 27, 2014
Source: NOAA/National Weather Service
Deviation between average and normal (°F)
7-Day Mean ending Mar 27, 2014
Source: NOAA/National Weather Service