In the News:
EIA projects robust growth in natural gas production, consumption, and trade
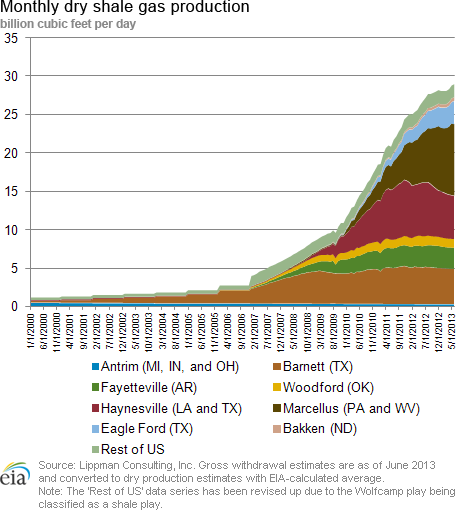
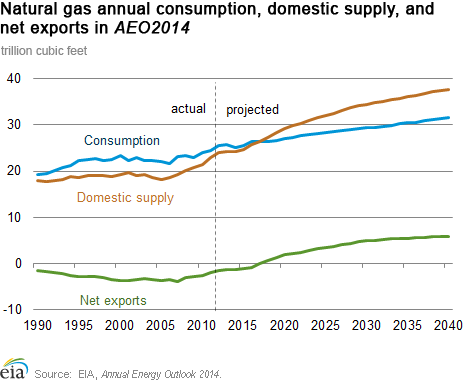
On Monday, EIA published its base case version of its 2014 Annual Energy Outlook (AEO2014). EIA predicted that natural gas production will rise steadily throughout the forecast period, reaching 37.5 trillion cubic feet (Tcf) per year by 2040, an increase of 56% over 2012 levels. This projected increase in production is notably higher than the outlook a year ago in AEO2013, largely the result of higher shale gas production growth. The increase in supply will satisfy higher growth in both domestic consumption and exports.
Shale gas production is expected to double, reaching 53% of all produced volumes by 2040, up from 40% in 2012. As with overall gas production, production from shale plays is higher than in AEO2013 because of an updated, more localized assessment of well recovery and decline rates. Natural gas from tight formations continues to be an important source of supply, as well.
Total domestic natural gas consumption is projected to grow by 6.0 Tcf from 2012 to 2040, when it would equal 44% of the 13.5 Tcf increase in U.S. production. Other highlights:
- All consumption sectors except residential grow significantly through 2040.
- The greatest increase occurs in industrial gas consumption, including lease and plant fuel, which will rise by 2.5 Tcf. This is 59% higher than projected in AEO2013, the result of increased manufacturing shipments, particularly for chemicals, as well as generally higher levels of energy intensity.
- The electric generation sector is projected to increase its gas consumption by 2.0 Tcf from 2012 to 2040 in AEO2014, up significantly from its projected 0.2-Tcf increase over this period in AEO2013. Natural gas satisfies the majority of growth in U.S. electric generation.
- The use of natural gas in the transportation sector also shows strong growth.
According to the AEO2014, the United States will become a net exporter of natural gas by 2017, two years earlier than seen in AEO2013. Net natural gas exports will reach 5.8 Tcf by 2040, versus net imports in 2012 of 1.5 Tcf. The growth in net exports accounts for 54% of projected production growth through 2040, and is 39% higher than projected in AEO2013. Other AEO2014 trade highlights:
- Net LNG exports will rise by 3.5 Tcf over the AEO2014 projection period. This increase is attributable to a more optimistic assessment of the number of liquefaction trains that can simulataneously be constructed in North America, as well as the increased capacity to produce natural gas domestically.
- By 2040, net pipeline exports to Mexico will grow to 3.1 Tcf, from 0.6 Tcf in 2012. This growth is 32% higher than seen in AEO2013, as the AEO2014 factors in the effect of additional pipeline infrastructure built for the Mexican market to receive more gas from the United States via pipeline, and less gas from LNG imports.
- While the United States is projected to continue to be a net importer of natural gas from Canada, the volume decreases to 0.7 Tcf by 2040, versus 2.0 Tcf in 2012. Pipeline imports from Canada are largely projected to occur in the western United States, with exports to Canada from the eastern United States projected to increase significantly.
Overview:
(For the Week Ending Wednesday, December 18, 2013)
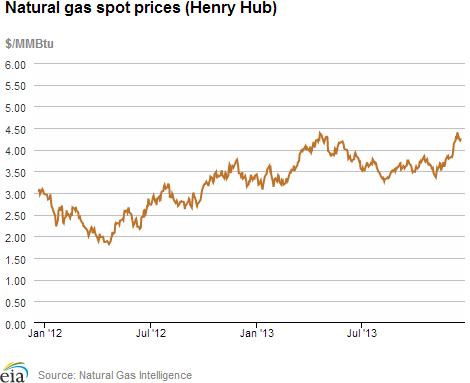
- Natural gas spot prices increased substantially at most trading locations in the country. The Henry Hub spot price rose from $3.88/MMBtu last Wednesday, December 4, to $4.24/MMBtu yesterday.
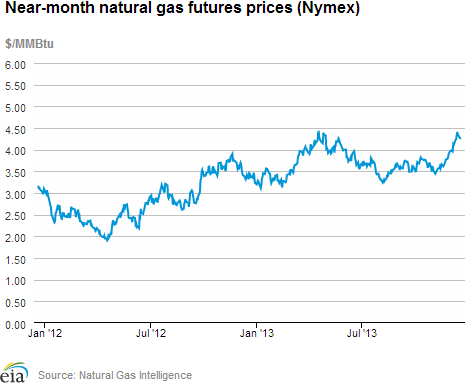
- At the New York Mercantile Exchange, the January 2014 contract rose from $3.960/MMBtu last Wednesday to $4.337/MMBtu yesterday.
- Working natural gas in storage decreased to 3,533 Bcf as of Friday, December 6, according to the U.S. Energy Information Administration (EIA) Weekly Natural Gas Storage Report (WNGSR). A net storage withdrawal of 81 Bcf for the week resulted in storage levels 7.2% below year-ago levels and 3.0% below the 5-year average.
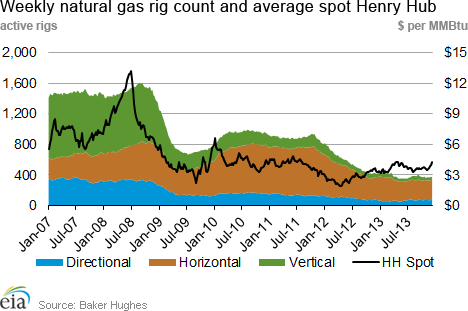
- The natural gas rotary rig count totaled 375 this week, an increase of 8 from the previous week, according to data released December 6 by Baker Hughes Inc. The oil rig count rose by 6 to 1,397 active units. The total rig count is 1,775, up 12 rigs from the previous week, but down 25 from a year ago.
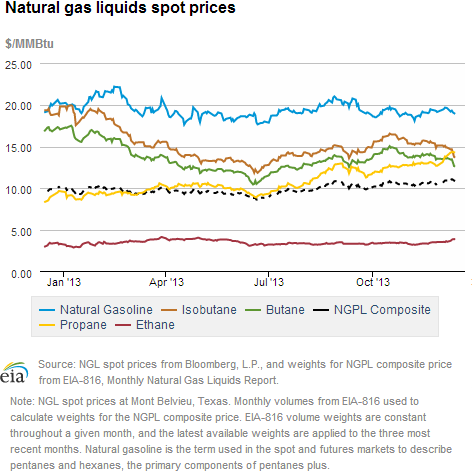
- The weekly average natural gas plant liquids composite price rose 3.0% this week (covering December 2 through December 6) compared to the previous week, and is now at $10.94/MMBtu. Propane drove the increase in the composite price, rising by 6.9% over this period. Ethane and natural gasoline are also up by 1.3% and 1.7%, respectively, and butane and isobutane are both down slightly.
Prices/Demand/Supply:
Prices rise substantially in most parts of the country. With cold weather covering most of the United States, increased demand in the residential/commercial sectors, combined with reduced gas production because of well freeze-offs, pushed prices up significantly.
The Henry Hub spot price in Erath, Louisiana, rose from $3.88/MMBtu last Wednesday to $4.24/MMBtu yesterday, an increase of 9%. Northeastern price points saw the most substantial increases, with Boston's Algonquin Citygate rising from $4.13/MMBtu last Wednesday to $20.40 yesterday. New York City spot gas also increased, with Transco Zone 6-NY rising from $3.85/MMBtu last Wednesday to $8.02/MMBtu on Tuesday, ending at $16.54 yesterday. New pipeline infrastructure into New York City has helped alleviate wintertime gas price spikes compared with Boston to a degree.
The Northwest Sumas spot price serving the Pacific Northwest jumped from $4.87/MMBtu last Thursday to $10.91 last Friday because of regional storage constraints and freeze-offs in Rockies production. The Sumas price dropped back down on Monday and settled at $4.75 yesterday.
Natural gas futures price rises 38 cents/MMBtu over the week. The near-month (January 2014) futures price began the report week at $3.960/MMBtu and ended at $4.337/MMBtu. The 12-month strip (the average of the 12 contracts between January 2014 and December 2014) rose by 26 cents to $4.246/MMBtu yesterday.
Natural gas liquids prices are up week-on-week based on rising propane prices. The weekly average natural gas plant liquids composite price rose 3.0% this week to $10.94/MMBtu. Propane spot prices were the largest contributor to the composite increase, rising by 6.9% because of elevated demand. A wet, record corn harvest (requiring propane for drying), combined with increased propane exports, have caused supply constraints in several midwestern states, which led to rising propane prices.
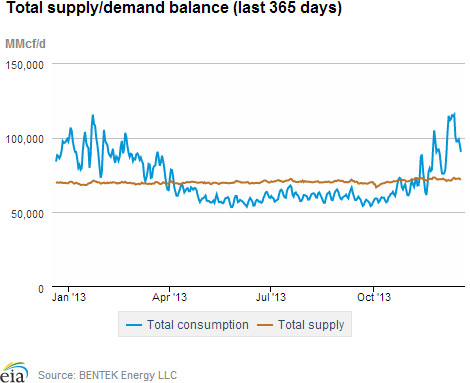
Gas consumption rises significantly on cold weather. Total natural gas consumption for the report week rose 33.4% relative to last week. Residential/commercial sector and electric sector consumption increased by 46.1% and 40.5%, respectively, for home and building heating. The largest percentage increases in electric-sector consumption of natural gas came from the Midwest and the Midcontinent, up 183% and 155%, respectively. Texas, the second-largest electric-sector gas consuming region, increased by 73% and saw the largest volumetric increase, and the Southeast, which is most reliant on electricity for home-heating, consumed 20% more natural gas to generate electricity.
Total supply declines slightly over the week. Total natural gas supply fell by 0.8% for the report period on lower levels of production. U.S. dry gas production decreased 3.3% this week following well freeze-offs. Wide-spread freeze-offs occurred in the Piceance Basin in Utah and Wyoming, the Uinta Basin in Utah, the San Joaquin Basin in California, and the Williston Basin in North Dakota. This was partly offset by imports from Canada, which were up 30.5% for the report period. The Midwest and Northeast both imported about 1 Bcf/day more natural gas from Canada yesterday compared with last Wednesday. LNG imports, which are a minor part of supply, were also up.
Storage
Correction: January 13, 2014, text below was modified and updated.
Gas storage sees a larger than average net withdrawal. The net withdrawal reported this week was 285 Bcf. The previous record withdrawal was 274 Bcf in January 2008. The previously largest recorded December withdrawal was 208 Bcf, in December 2000, when the WNGSR was published by the American Gas Association. December withdrawals have averaged 109 Bcf per week since 2008. This week's withdrawal is 215 Bcf larger than last year's withdrawal of 70 Bcf and 152 Bcf larger than the 5-year average withdrawal of 133 Bcf. Current inventories totaling 3,248 Bcf are 488 Bcf (13.1%) less than last year at this time, and 261 Bcf (7.4%) below the 5-year (2008-12) average.
Net withdrawal is significantly larger than market expectations of 264 Bcf. At 10:30 a.m., when the EIA storage report was released, prices for natural gas futures on the Nymex increased by 7 cents/MMBtu. In the hour following the release, prices climbed an additional 6 cents/MMBtu, to just under $4.44/MMBtu.
Only the West region posted a record withdrawal. Although the largest withdrawals occurred in the East and Producing regions, which had net withdrawals of 132 Bcf and 99 Bcf, respectively, only the West region posted a record withdrawal. This week's withdrawal of -54 Bcf in the West was higher than the previous record withdrawal, which was 43 Bcf in January 2007. The previous December record withdrawal was 39 Bcf in December 2009. This week's withdrawal of 132 Bcf in the East was substantially lower than the previous record, which was 179 Bcf in February 2007. In the East, the December record withdrawal was 142 Bcf, in December 2000. In the Producing region, this week's withdrawal of 99 Bcf was slightly lower than the previous record of 100 Bcf in January 2010, but it broke the previous December record withdrawal of 75 Bcf from December 2009. Storage capacity, particularly in high deliverability salt facilities located predominately in the Producing region, has grown over time, making larger withdrawals possible.
Cold weather during the storage report week prompted the large withdrawal. Temperatures in the Lower 48 states averaged 29.3 degrees for the week, 9.1 degrees cooler than the 30-year normal temperature and 15.1 degrees cooler than the same period last year. Parts of the Midwest experienced below-freezing weather for the entire week, with temperatures as much as 20 degrees below the seasonal norm. Natural gas production was also down, as many locations experienced well freeze-offs in the first half of the storage week. Storage operators met this elevated heating demand by executing large net withdrawals on behalf of their customers.
See also:
| Spot Prices ($/MMBtu) | Thu, 12-Dec |
Fri, 13-Dec |
Mon, 16-Dec |
Tue, 17-Dec |
Wed, 18-Dec |
|---|---|---|---|---|---|
| Henry Hub | 4.40 |
4.35 |
4.22 |
4.21 |
4.26 |
| New York | 6.62 |
7.20 |
6.91 |
5.01 |
4.39 |
| Chicago | 4.67 |
4.62 |
4.49 |
4.40 |
4.49 |
| Cal. Comp. Avg,* | 4.70 |
4.57 |
4.41 |
4.36 |
4.47 |
| Futures ($/MMBtu) | |||||
| January Contract | 4.409 |
4.351 |
4.279 |
4.287 |
4.251 |
| February Contract | 4.401 |
4.350 |
4.286 |
4.304 |
4.274 |
*Avg. of NGI's reported prices for: Malin, PG&E citygate, and Southern California Border Avg. |
| Source: NGI's Daily Gas Price Index | |||||
| U.S. Natural Gas Supply - Gas Week: (12/11/13 - 12/18/13) | ||
|---|---|---|
Percent change for week compared with: |
||
last year |
last week |
|
| Gross Production | 0.95%
|
1.65%
|
| Dry Production | 0.94%
|
1.63%
|
| Canadian Imports | 51.97%
|
-3.88%
|
| West (Net) | 50.83%
|
11.41%
|
| MidWest (Net) | 63.06%
|
-30.83%
|
| Northeast (Net) | 40.52%
|
27.71%
|
| LNG Imports | 1.61%
|
42.31%
|
| Total Supply | 4.15%
|
1.24%
|
| Source: BENTEK Energy LLC | ||
| U.S. Consumption - Gas Week: (12/11/13 - 12/18/13) | ||
|---|---|---|
Percent change for week compared with: |
||
last year |
last week |
|
| U.S. Consumption | 26.4%
|
-8.8%
|
| Power | 15.4%
|
-15.5%
|
| Industrial | 6.5%
|
-0.5%
|
| Residential/Commercial | 44.0%
|
-8.9%
|
| Total Demand | 25.9%
|
-8.6%
|
| Source: BENTEK Energy LLC | ||
| Rigs | |||
|---|---|---|---|
Fri, December 13, 2013 |
Change from |
||
last week |
last year |
||
| Oil Rigs | 1,411 |
1.00% |
2.17% |
| Natural Gas Rigs | 369 |
-1.60% |
-11.30% |
| Miscellaneous | 2 |
-33.33% |
0.00% |
| Rig Numbers by Type | |||
|---|---|---|---|
Fri, December 13, 2013 |
Change from |
||
last week |
last year |
||
| Vertical | 407 |
-1.93% |
-19.25% |
| Horizontal | 1,145 |
0.70% |
3.62% |
| Directional | 230 |
3.14% |
21.05% |
| Source: Baker Hughes Inc. | |||
| Working Gas in Underground Storage | ||||
|---|---|---|---|---|
Stocks billion cubic feet (bcf) |
||||
| Region | 12/13/13
|
12/6/13
|
change |
|
| East | 1,683 |
1,815 |
-132
|
|
| West | 450 |
504 |
-54
|
|
| Producing | 1,115 |
1,214 |
-99
|
|
| Total | 3,248 |
3,533 |
-285
|
|
| Source: U.S. Energy Information Administration | ||||
| Working Gas in Underground Storage | |||||
|---|---|---|---|---|---|
Historical Comparisons |
|||||
Year ago (12/13/12) |
5-year average (2008-2012) |
||||
| Region | Stocks (Bcf) |
% change |
Stocks (Bcf) |
% change |
|
| East | 1,932 |
-12.9 |
1,890 |
-11.0 |
|
| West | 539 |
-16.5 |
481 |
-6.4 |
|
| Producing | 1,264 |
-11.8 |
1,138 |
-2.0 |
|
| Total | 3,736 |
-13.1 |
3,509 |
-7.4 |
|
| Source: U.S. Energy Information Administration | |||||
| Temperature -- Heating & Cooling Degree Days (week ending Dec 12) | ||||||||
|---|---|---|---|---|---|---|---|---|
HDD deviation from: |
CDD deviation from: |
|||||||
| Region | HDD Current |
normal |
last year |
CDD Current |
normal |
last year |
||
| New England | 238
|
17
|
70
|
0
|
0
|
0
|
||
| Middle Atlantic | 240
|
30
|
77
|
0
|
0
|
0
|
||
| E N Central | 331
|
90
|
131
|
0
|
0
|
0
|
||
| W N Central | 390
|
123
|
154
|
0
|
0
|
0
|
||
| South Atlantic | 146
|
-2
|
59
|
18
|
10
|
4
|
||
| E S Central | 194
|
42
|
112
|
0
|
-1
|
0
|
||
| W S Central | 211
|
98
|
131
|
0
|
-3
|
-9
|
||
| Mountain | 311
|
91
|
118
|
0
|
0
|
0
|
||
| Pacific | 173
|
56
|
86
|
0
|
-1
|
0
|
||
| United States | 253
|
65
|
106
|
3
|
1
|
0
|
||
|
Note: HDD = heating degree-day; CDD = cooling degree-day Source: National Oceanic and Atmospheric Administration | ||||||||
Average temperature (°F)
7-Day Mean ending Dec 12, 2013
Source: NOAA/National Weather Service
Deviation between average and normal (°F)
7-Day Mean ending Dec 12, 2013
Source: NOAA/National Weather Service