In the News:
EIA projects lower natural gas use this winter
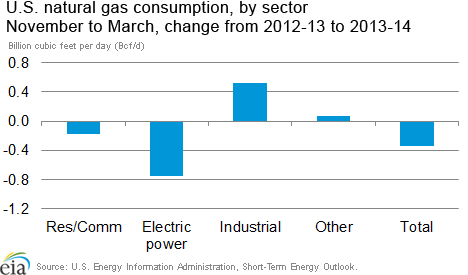
The U.S. Energy Information Administration (EIA) forecasts that reduced natural gas consumption from electric generators (power burn) driven by higher gas prices will play an instrumental role in pushing down total natural gas consumption this winter (November 2013 to March 2014) compared to last winter (November 2012 to March 2013). Residential and commercial consumption is expected to remain relatively flat as temperatures hold steady over last winter. EIA will present its Winter Fuels Outlook tomorrow at the NASEO Winter Energy Outlook Conference in Washington, DC.
EIA's winter forecast calls for a 13.2% annual increase in the Henry Hub natural gas spot price this winter over last winter, rising from $3.47/million British thermal units (MMBtu) to $3.93/MMBtu, as flattening production and higher consumption from generators has pushed working gas inventories below year-ago levels. This is particularly the case in the Producing region, where end-of-October storage is more sensitive to market conditions, and in the East, where storage has fallen below five-year average levels. Largely in response to higher gas prices, generators are expected to taper back their natural gas consumption to an average of 18.9 billion cubic feet per day (Bcf/d), 0.8 Bcf/d, or 3.8%, below the power burn last winter.
Both residential and commercial consumption, which typically combine to account for more than 40% of total natural gas consumption in winter months, are forecast to decrease slightly, with temperatures expected to remain relatively flat compared to last winter. Combined residential and commercial consumption is forecast to decrease from 36.2 Bcf/d last winter to 36.0 Bcf/d this winter, consistent with a very slight decline in heating degree days (HDDs). Although cooler temperatures are expected for important gas markets in the eastern United States, including New England and the Middle Atlantic, the effect of colder weather in these areas likely will be muted by slightly warmer temperatures to the west.
The combined 1.0 Bcf/d forecasted decrease in consumption from the residential/commercial and electric power sectors is slightly offset by a 0.5 Bcf/d increase in consumption from industrial users, and a smaller rise in consumption from vehicles, plants, pipelines, and other sources. Industrial natural gas use has risen steadily over year-ago levels. Industrial customers, like residential/commercial consumers, generally respond more slowly to changes in price than consumers in the electric power sector.
Overview:
(For the Week Ending Wednesday, October 30, 2013)
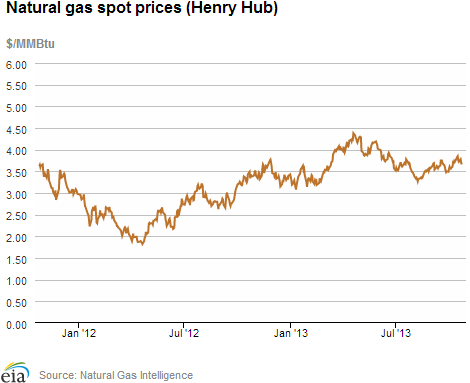
- Natural gas prices decreased across most of the country over the report week (Wednesday to Wednesday). The Henry Hub spot price closed yesterday at $3.55/MMBtu, down about a dime from $3.66/MMBtu at the beginning of the report week.
- At the New York Mercantile Exchange (Nymex), the November contract expired and settled at $3.496/MMBtu on Tuesday, down 12 cents per MMBtu from last week, and the December contract moved into prompt position. The December contract settled at $3.620 yesterday, down 11 cents per MMBtu for the report period.
- Working natural gas in storage increased to 3,779 Bcf as of Friday, October 25, according to the EIA's Weekly Natural Gas Storage Report (WNGSR). A net storage injection of 38 Bcf for the week resulted in storage levels 3.1% below year-ago levels but 1.6% above the 5-year average.
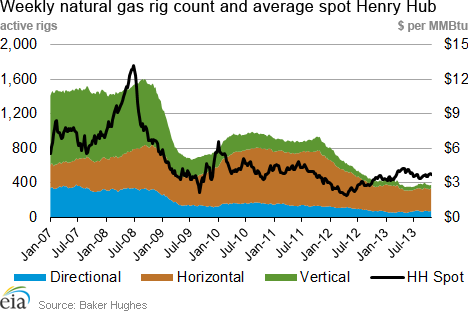
- The Baker Hughes natural gas rotary rig count totaled 376 active units as of Friday, October 18, an increase of four rigs from the previous week. Before that increase, natural gas rigs had declined on average three rigs per week for the past five months. The oil rig count decreased by four to 1,357. The total rig count is 1,738, down one rig for the week.
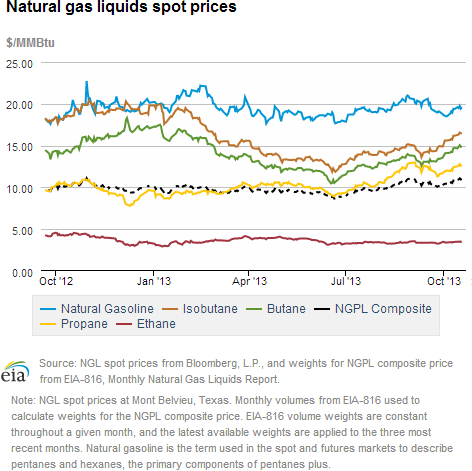
- The weekly average natural gas plant liquids composite price fell this week (covering October 21 through October 25) compared to the previous week by 1.5%, and is now at $10.81/MMBtu. Heavy natural gas liquids (natural gasoline, butane, and isobutane) fell by between 2% and 3%, likely due to declines in the crude oil spot price, and light liquids (ethane and propane) each fell by around 0.5%.
Prices/Demand/Supply:
Spot prices fell throughout the country on calls for warmer weather to come. Despite similar temperatures this report week compared to last report week, prices are generally down on forecasts of unseasonably warm weather later this week. The Henry Hub spot price fell by 11 cents to $3.55/MMBtu yesterday from $3.66 last Wednesday. Price points at hubs supplying gas to large metropolitan areas saw the largest decreases. Transco Zone 6 New York, delivering to New York City, fell by 33 cents per MMBtu, from $3.95/ MMBtu last Wednesday to $3.62/MMBtu yesterday. Chicago Citygate fell by 20 cents per MMBtu, from $3.93 last Wednesday to $3.73/ MMBtu yesterday. Much of this price decline occurred between Monday and Tuesday.
Prices at the Nymex decreased this week. The November 2013 contract fell from $3.619/MMBtu last Wednesday to $3.496 on its Tuesday expiration as the prompt month. The new prompt month contract, for December, closed yesterday at $3.620, 11 cents below the last Wednesday December contract price. The price of the 12-month strip fell from $3.802/MMBtu last Wednesday to $3.741/MMBtu yesterday.
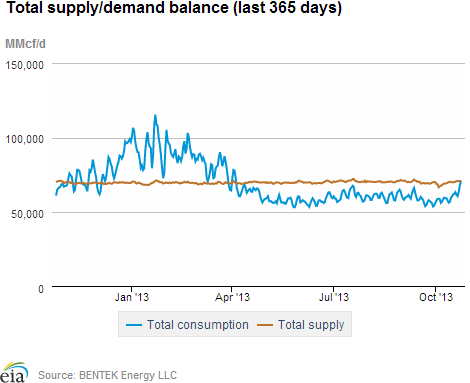
Consumption increased during the report week, driven by the residential and commercial sectors. Consumption increased by 4.9% from the previous week, largely because of a 14.1% increase in residential and commercial consumption, according to data from Bentek Energy. This rise in space heating demand was the result of colder weather in the Northeast and Midwest. During the report week, natural gas consumption for power generation fell by 1.2%. As the season for air conditioning nears an end, almost every region consumed less gas for power generation, with the exception of Texas. Texas consumed 25.1% more gas in the electric sector on warm weather earlier in the week. Industrial sector gas consumption was up slightly, increasing by 0.6%, and U.S. natural gas exports to Mexico increased substantially, rising by 16.9% over last week.
Natural gas supply increased modestly during the report week. Total supply increased by 0.8% over the previous week. Dry gas production increased for the week by 0.9%, while imports of natural gas from Canada fell 0.1%. Net natural gas imports from Canada in the West and Midwest accounted for most natural gas imports from Canada, and fell by 2.0% and 11.1%, respectively. These declines were offset by rising net imports in the Northeast. Imports of LNG fell over the report week; LNG continues to be a small contributor to total U.S. natural gas supply.
Storage
Working natural gas in storage rose to 3,779 Bcf as of October 25. The 38-Bcf gain in storage levels was significantly smaller than both the 66-Bcf injection that occurred during the same week in 2012 and the 5-year average increase of 57 Bcf. Current inventories are 120 Bcf (3.1%) less than last year at this time, but 58 Bcf (1.6%) above the 5-year (2008-12) average of 3,721 Bcf.
The net injection was greater than market expectations of 34 Bcf. However, price movements on the Nymex upon release of the storage numbers were relatively small. At 10:30 a.m., the price of the near month (December 2013) contract fell about 2 cents to $3.56/MMBtu, but rose to $3.59 minutes later. In the hour following the release, prices fell a penny to $3.58.
All three regions posted smaller-than-average builds. Net injections in the East region were 17 Bcf this week, 11 Bcf smaller than its 5-year average injection of 28 Bcf, and stocks remain 4.4% below the 5-year average for that region. Inventories in the Producing region grew by 18 Bcf this week, 4 Bcf smaller than its 5-year average injection of 22 Bcf, and stocks in that region are 8.8% over its 5-year average levels. The West region grew by 3 Bcf, 3 Bcf lower than its 5-year injection of 6 Bcf.
Cooler temperatures led to relatively small build. Temperatures in the Lower 48 states averaged 52.9 degrees for the week, 1.9 degrees cooler than the 30-year normal temperature and 5.4 degrees cooler than the same period last year. That suggests that more natural gas was used for space heating that week than for storage for the winter.
See also:
| Spot Prices ($/MMBtu) | Thu, 24-Oct |
Fri, 25-Oct |
Mon, 28-Oct |
Tue, 29-Oct |
Wed, 30-Oct |
|---|---|---|---|---|---|
| Henry Hub | 3.65 |
3.67 |
3.62 |
3.56 |
3.55 |
| New York | 3.84 |
3.84 |
3.79 |
3.70 |
3.62 |
| Chicago | 3.89 |
3.91 |
3.83 |
3.75 |
3.73 |
| Cal. Comp. Avg,* | 3.83 |
3.88 |
3.82 |
3.82 |
3.79 |
| Futures ($/MMBtu) | |||||
| November Contract | 3.629 |
3.707 |
3.569 |
3.496 |
Expired |
| December Contract | 3.743 |
3.812 |
3.661 |
3.629 |
3.620 |
| January Contract | 3.825 |
3.886 |
3.739 |
3.714 |
3.711 |
*Avg. of NGI's reported prices for: Malin, PG&E citygate, and Southern California Border Avg. |
| Source: NGI's Daily Gas Price Index | |||||
| U.S. Natural Gas Supply - Gas Week: (10/23/13 - 10/30/13) | ||
|---|---|---|
Percent change for week compared with: |
||
last year |
last week |
|
| Gross Production | 1.71%
|
0.87%
|
| Dry Production | 1.70%
|
0.86%
|
| Canadian Imports | -3.88%
|
-0.11%
|
| West (Net) | 11.96%
|
-1.99%
|
| MidWest (Net) | -10.08%
|
-11.12%
|
| Northeast (Net) | -38.13%
|
2540.66%
|
| LNG Imports | -45.07%
|
-3.08%
|
| Total Supply | 1.06%
|
0.78%
|
| Source: BENTEK Energy LLC | ||
| U.S. Consumption - Gas Week: (10/23/13 - 10/30/13) | ||
|---|---|---|
Percent change for week compared with: |
||
last year |
last week |
|
| U.S. Consumption | 4.52%
|
4.91%
|
| Power | -4.33%
|
-1.18%
|
| Industrial | 1.12%
|
0.63%
|
| Residential/Commercial | 15.86%
|
14.10%
|
| Total Demand | 4.44%
|
5.18%
|
| Source: BENTEK Energy LLC | ||
| Rigs | |||
|---|---|---|---|
Fri, October 25, 2013 |
Change from |
||
last week |
last year |
||
| Oil Rigs | 1,357 |
-0.29% |
-3.62% |
| Natural Gas Rigs | 376 |
1.08% |
-9.62% |
| Miscellaneous | 5 |
-16.67% |
150.00% |
| Rig Numbers by Type | |||
|---|---|---|---|
Fri, October 25, 2013 |
Change from |
||
last week |
last year |
||
| Vertical | 391 |
-2.49% |
-23.63% |
| Horizontal | 1,098 |
-0.09% |
-0.63% |
| Directional | 249 |
4.18% |
19.14% |
| Source: Baker Hughes Inc. | |||
| Working Gas in Underground Storage | ||||
|---|---|---|---|---|
Stocks billion cubic feet (bcf) |
||||
| Region | 10/25/13
|
10/18/13
|
change |
|
| East | 1,964 |
1,947 |
17
|
|
| West | 552 |
549 |
3
|
|
| Producing | 1,263 |
1,245 |
18
|
|
| Total | 3,779 |
3,741 |
38
|
|
| Source: U.S. Energy Information Administration | ||||
| Working Gas in Underground Storage | |||||
|---|---|---|---|---|---|
Historical Comparisons |
|||||
Year ago (10/25/12) |
5-year average (2008-2012) |
||||
| Region | Stocks (Bcf) |
% change |
Stocks (Bcf) |
% change |
|
| East | 2,086 |
-5.8 |
2,055 |
-4.4 |
|
| West | 539 |
2.4 |
504 |
9.5 |
|
| Producing | 1,274 |
-0.9 |
1,161 |
8.8 |
|
| Total | 3,899 |
-3.1 |
3,721 |
1.6 |
|
| Source: U.S. Energy Information Administration | |||||
| Temperature -- Heating & Cooling Degree Days (week ending Oct 24) | ||||||||
|---|---|---|---|---|---|---|---|---|
HDD deviation from: |
CDD deviation from: |
|||||||
| Region | HDD Current |
normal |
last year |
CDD Current |
normal |
last year |
||
| New England | 101
|
-12
|
21
|
0
|
0
|
0
|
||
| Middle Atlantic | 100
|
-2
|
29
|
0
|
0
|
0
|
||
| E N Central | 142
|
33
|
61
|
0
|
-1
|
0
|
||
| W N Central | 158
|
49
|
78
|
0
|
-1
|
-3
|
||
| South Atlantic | 68
|
10
|
22
|
27
|
5
|
5
|
||
| E S Central | 82
|
24
|
38
|
0
|
-7
|
-1
|
||
| W S Central | 43
|
18
|
32
|
11
|
-12
|
-34
|
||
| Mountain | 103
|
-1
|
24
|
8
|
0
|
-5
|
||
| Pacific | 23
|
-19
|
-14
|
0
|
-5
|
-13
|
||
| United States | 92
|
12
|
33
|
7
|
-1
|
-5
|
||
|
Note: HDD = heating degree-day; CDD = cooling degree-day Source: National Oceanic and Atmospheric Administration | ||||||||
Average temperature (°F)
7-Day Mean ending Oct 24, 2013
Source: NOAA/National Weather Service
Deviation between average and normal (°F)
7-Day Mean ending Oct 24, 2013
Source: NOAA/National Weather Service