In the News:
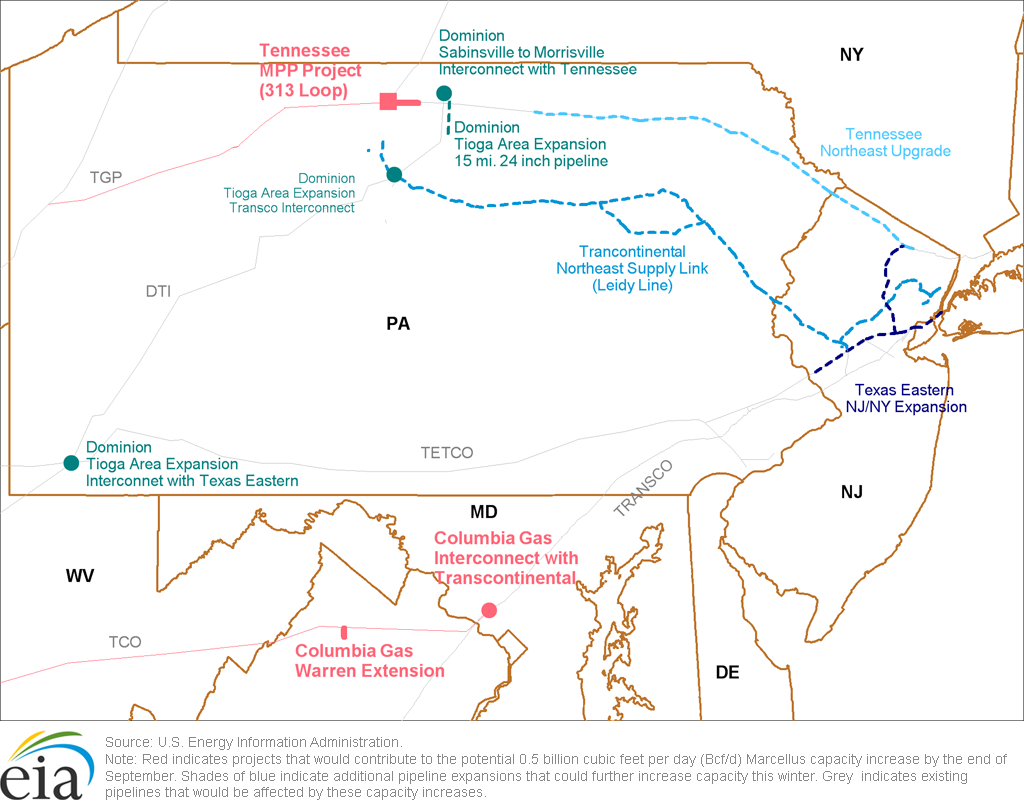
Marcellus gas pipe capacity seen rising 0.5 Bcf/d by month's end; additional expansions expected this winter
Initial service could begin by the end of September for two projects that would increase natural gas takeaway capacity from the Marcellus Shale formation by a combined 0.5 billion cubic feet per day (Bcf/d). These two projects are a 7.9 mile, 0.23 Bcf/d looping pipeline added to Kinder Morgan's Tennessee Gas Pipeline (TGP) (known as the MPP Project's "313 Loop") and a 2.5 mile, 0.22 Bcf/d pipeline connecting NiSource's Columbia Gas Transmission (TCO) pipeline to a 1,329-megawatt gas-fired Dominion power plant (known as the Warren County Extension project). Notably, these would be the first of several projects increasing natural gas takeaway capacity from Marcellus planned for completion this winter.
Last Friday, September 13, TGP applied to the Federal Energy Regulatory Commission (FERC) to begin service this coming Monday, September 23 on the 313 Loop, as well as the MPP Project's planned upgrades to an adjacent compressor station in northern Pennsylvania's Potter County. Service under its firm transportation agreements, however, would not begin until the originally agreed-upon date of November 1. By that date, TGP also plans to complete upgrades to three compressor stations in northern Pennsylvania west of Potter County to allow for bidirectional flow of natural gas.
Columbia's TCO requested FERC permission on September 6 to begin service on September 30 on the Warren County Extension pipeline in Northern Virginia. This project also includes upgrades to compressor stations along TCO's line carrying Marcellus gas east from West Virginia as well as the replacement of TCO's interconnect with Williams's Transcontinental Gas Pipeline (Transco), near Rockville, Maryland, which carries gas through the mid-Atlantic and into New York City.
Additional Marcellus gas takeaway capacity expected to come into service this winter includes:
- Dominion Transmission (DTI) plans to:
- establish a 0.09 Bcf/d interconnect with TGP in northern Pennsylvania's Tioga County (known as the Sabinesville to Morrisville project), and
- build new segments adjacent to an existing pipeline to carry an additional 0.26 Bcf/d of gas to interconnects with Transco in Leidy, Pennsylvania, as well as to Spectra's Texas Eastern Transmission Pipeline (TETCO), which carries gas into New York and New Jersey, in addition to other facility modifications (Tioga County Expansion project),
- TETCO plans to begin service on its 0.78 Bcf/d expansion to a portion of its pipeline running from Linden, New Jersey, to Manhattan, New York (NY-NJ Expansion project),
- Transco plans to complete work on 0.24 Bcf/d of expansions to its existing pipeline network, to move more gas from interconnects on its Leidy Line in Pennsylvania to delivery points in New Jersey and New York City (Northeast Supply Link Project), and
- TGP plans to build five looping lines and upgrade four compressor stations in order to add 0.62 Bcf/d of pipeline capacity from northern Pennsylvania to New Jersey (Northeast Upgrade Project).
Overview:
(For the Week Ending Wednesday, September 18, 2013)
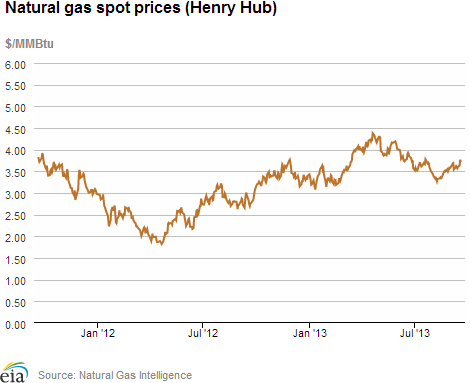
- Natural gas prices at trading locations outside of the Northeast rose moderately this report week (Wednesday, September 11 – Wednesday, September 18). The Henry Hub spot price rose 11 cents from $3.60 per million British thermal units (MMBtu) last Wednesday to $3.71 per MMBtu yesterday.
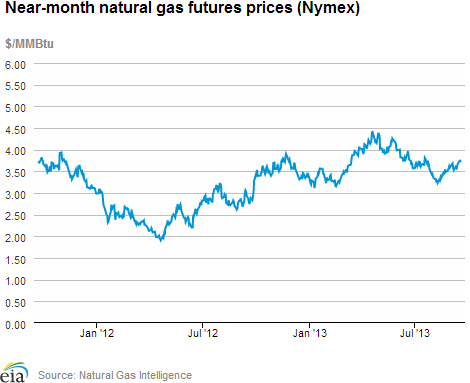
- The price of the near-month (October 2013) contract on the New York Mercantile Exchange (Nymex) also increased substantially during the week. The October contract rose from $3.567 per MMBtu last Wednesday to $3.713 yesterday.
- Working natural gas in storage increased to 3,299 Bcf as of Friday, September 13, according to the U.S. Energy Information Administration's (EIA) Weekly Natural Gas Storage Report (WNGSR). A net storage injection of 46 Bcf for the week resulted in storage levels 5.4% below year-ago levels and 0.5% above the 5-year average.
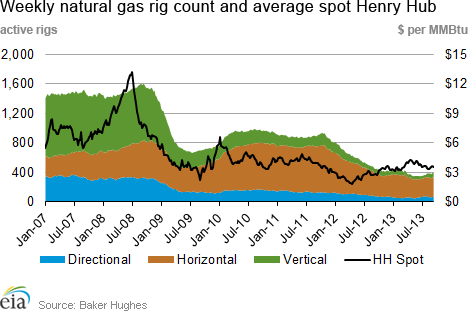
- The natural gas rotary rig count, as reported by Baker Hughes Inc., rose from the previous week by 7, to 401 active units. The oil rig count fell by 4, to 1,361.
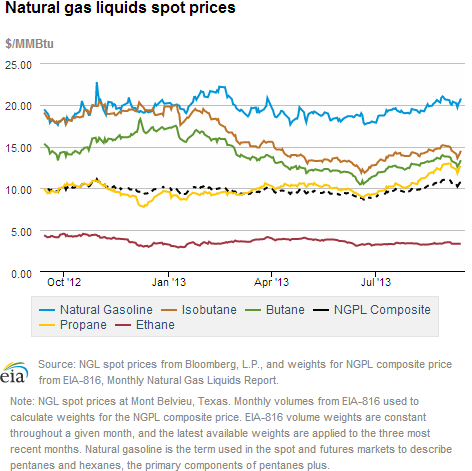
- The weekly average natural gas plant liquids composite price rose by 0.4% this week (covering September 7 through 14), and is now at $10.56 per MMBtu. Natural gasoline, butane, isobutane, and propane prices all increased, while ethane prices declined by 0.1%.
Prices/Demand/Supply:
Outside of the Northeast, natural gas prices increased over the report week at most locations. The Henry Hub spot price rose from $3.60 per MMBtu on Wednesday a week ago to $3.71 per MMBtu yesterday, and prices at most locations behaved similarly to the Henry Hub changes. For example, at the Chicago Citygate, prices rose 11 cents from $3.73 per MMBtu last week to $3.84 per MMBtu yesterday. In California, prices at the Pacific Gas & Electric Citygate rose 14 cents from $3.95 per MMBtu last Wednesday to $4.09 per MMBtu yesterday.
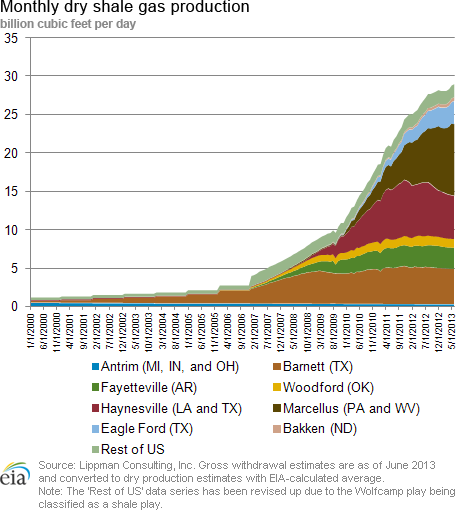
Prices in Appalachia plummeted to pennies on pipeline maintenance and mild weather. Maintenance on Transcontinental Pipeline's system this week restricted flows through Luzerne County, Pennsylvania. This resulted in stranded gas at various points in Appalachia, where prices are frequently very low to begin with because the transportation infrastructure in the region does not support the volumes of production from the Marcellus Shale. Prices settled at 36 cents per MMBtu on Tuesday at Tennessee Pipeline's Zone 4 trading point in the Marcellus, and traded as low at 10 cents during the day. Similarly, prices at Transco's Leidy trading point in Pennsylvania settled at 34 cents on Tuesday, and trade press reports indicated lows of less than one cent during intraday trading. By Wednesday, prices had recovered somewhat, and Marcellus points were trading between $1 and $2 per MMBtu. Maintenance is expected to continue through Sunday.
Flooding in Colorado resulted in well closures and production shut-ins. On Tuesday, the Colorado Oil and Gas Association said 1,900 oil and natural gas wells had been shut in because of floods. Also, Colorado Interstate Gas Company on Monday declared force majeure, rendering two pipeline segments out of service. The declines in supply may have contributed to increases in the 30-cent range at most Colorado trading points.
Prices at the Nymex increased along with spot prices this week. The October contract rose from $3.567 per MMBtu last Wednesday to $3.713 yesterday. The price of the 12-month strip (the average of the 12 contracts between October 2013 and September 2013) rose from $3.805 per MMBtu on Wednesday last week to $3.937 per MMBtu yesterday.
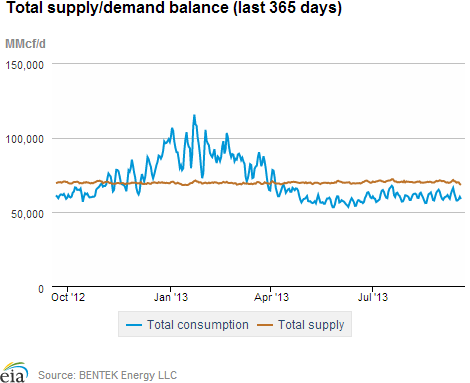
Both consumption and supply declined during the report week. According to data from Bentek Energy LLC, total supply fell 0.8%, with a production decline of 300 million cubic feet per day (0.4%) (partly due to Rockies losses), accounting for most of the decline in overall supply. Canadian pipeline imports declined by 3.5% and LNG imports remained at minimal levels. On the demand side, residential and commercial consumption increased 20.9% this week, a sign that seasonally cooler weather has arrived in some areas of the country. However, a 16.1% decline in gas consumption for power generation helped offset the increase in residential and commercial consumption, resulting in a 4% net decline in total consumption
Storage
Working natural gas in storage increased to 3,299 Bcf as of Friday, September 13. The 46-Bcf gain in storage levels was significantly lower than both the 61-Bcf injection that occurred during the same week in 2012 and the 5-year average increase of 74 Bcf. Current inventories are 187 Bcf (5.4%) less than last year at this time and 18 Bcf (0.5%) above the 5-year average of 3,281 Bcf.
The net injection was smaller than market expectations of 56 Bcf. The lower-than-expected build contributed to natural gas prompt-month Nymex futures prices increasing by about 5 cents per MMBtu to just around $3.80 per MMBtu immediately following WNGSR's release. In the hour following the release, prices fell 2 cents and were trading about 3 cents per MMBtu higher than the pre-release prices.
All three regions posted lower-than-average builds; East remains below 5-year average storage levels. Net injections in the East region were 41 Bcf this week, 8 Bcf lower than its 5-year average injection of 49 Bcf, and stocks remain 6.7% below the 5-year average for that region. Inventories in the Producing region grew by 1 Bcf this week, 16 Bcf lower than its 5-year average injection of 17 Bcf, but stocks in that region remain 8.9% over its 5-year average levels.
Higher-than-normal temperatures during the storage report week supported this week's lower-than-average net injection. Temperatures in the Lower 48 states averaged 4.6 degrees warmer than the 30-year normal temperature and 2.3 degrees warmer than the same period last year, and averaged 73.9 degrees for the week, compared to the 30-year normal of 69.3 degrees and 71.6 degrees last year.
See also:
| Spot Prices ($/MMBtu) | Thu, 12-Sep |
Fri, 13-Sep |
Mon, 16-Sep |
Tue, 17-Sep |
Wed, 18-Sep |
|---|---|---|---|---|---|
| Henry Hub |
3.57 |
3.60 |
3.64 |
3.77 |
3.71 |
| New York |
3.72 |
3.72 |
3.79 |
3.94 |
3.91 |
| Chicago |
3.67 |
3.69 |
3.80 |
3.89 |
3.84 |
| Cal. Comp. Avg,* |
3.70 |
3.70 |
3.81 |
3.95 |
3.86 |
| Futures ($/MMBtu) | |||||
| October Contract |
3.638 |
3.677 |
3.738 |
3.745 |
3.713 |
| November Contract |
3.712 |
3.755 |
3.814 |
3.822 |
3.787 |
| *Avg. of NGI's reported prices for: Malin, PG&E citygate, and Southern California Border Avg. | |||||
| Source: NGI's Daily Gas Price Index | |||||
| U.S. Natural Gas Supply - Gas Week: (9/11/13 - 9/18/13) | ||
|---|---|---|
Percent change for week compared with: |
||
last year |
last week |
|
| Gross Production | 0.29%
|
-0.44%
|
| Dry Production | 0.28%
|
-0.43%
|
| Canadian Imports | -0.06%
|
-3.49%
|
| West (Net) | 15.76%
|
-0.45%
|
| MidWest (Net) | 6.67%
|
-5.95%
|
| Northeast (Net) | -91.94%
|
-47.47%
|
| LNG Imports | -46.88%
|
-25.40%
|
| Total Supply | -0.02%
|
-0.78%
|
| Source: BENTEK Energy LLC | ||
| U.S. Consumption - Gas Week: (9/11/13 - 9/18/13) | ||
|---|---|---|
Percent change for week compared with: |
||
last year |
last week |
|
| U.S. Consumption | 1.63%
|
-3.61%
|
| Power | -0.49%
|
-16.14%
|
| Industrial | 0.06%
|
1.65%
|
| Residential/Commercial | 7.98%
|
20.95%
|
| Total Demand | 1.31%
|
-4.05%
|
| Source: BENTEK Energy LLC | ||
| Rigs | |||
|---|---|---|---|
Fri, September 13, 2013 |
Change from |
||
last week |
last year |
||
| Oil Rigs | 1,361 |
-0.29% |
-3.68% |
| Natural Gas Rigs | 401 |
1.78% |
-10.49% |
| Miscellaneous | 6 |
-25.00% |
100.00% |
| Rig Numbers by Type | |||
|---|---|---|---|
Fri, September 13, 2013 |
Change from |
||
last week |
last year |
||
| Vertical | 444 |
0.45% |
-15.27% |
| Horizontal | 1,076 |
0.09% |
-5.03% |
| Directional | 248 |
-0.80% |
19.81% |
| Source: Baker Hughes Inc. | |||
| Working Gas in Underground Storage | ||||
|---|---|---|---|---|
Stocks billion cubic feet (bcf) |
||||
| Region | 9/13/13
|
9/6/13
|
change |
|
| East | 1,688 |
1,647 |
41
|
|
| West | 511 |
507 |
4
|
|
| Producing | 1,100 |
1,099 |
1
|
|
| Total | 3,299 |
3,253 |
46
|
|
| Source: U.S. Energy Information Administration | ||||
| Working Gas in Underground Storage | |||||
|---|---|---|---|---|---|
Historical Comparisons |
|||||
Year ago (9/13/12) |
5-year average (2008-2012) |
||||
| Region | Stocks (Bcf) |
% change |
Stocks (Bcf) |
% change |
|
| East | 1,869 |
-9.7 |
1,810 |
-6.7 |
|
| West | 497 |
2.8 |
461 |
10.8 |
|
| Producing | 1,121 |
-1.9 |
1,010 |
8.9 |
|
| Total | 3,486 |
-5.4 |
3,281 |
0.5 |
|
| Source: U.S. Energy Information Administration | |||||
| Temperature -- Heating & Cooling Degree Days (week ending Sep 12) | ||||||||
|---|---|---|---|---|---|---|---|---|
HDD deviation from: |
CDD deviation from: |
|||||||
| Region | HDD Current |
normal |
last year |
CDD Current |
normal |
last year |
||
| New England | 29
|
10
|
16
|
22
|
14
|
-7
|
||
| Middle Atlantic | 14
|
3
|
5
|
31
|
12
|
-5
|
||
| E N Central | 4
|
-13
|
-13
|
60
|
41
|
36
|
||
| W N Central | 2
|
-21
|
-15
|
79
|
52
|
47
|
||
| South Atlantic | 0
|
-2
|
-3
|
83
|
14
|
3
|
||
| E S Central | 0
|
-2
|
-3
|
89
|
30
|
22
|
||
| W S Central | 0
|
-2
|
0
|
119
|
26
|
14
|
||
| Mountain | 4
|
-24
|
-6
|
53
|
7
|
0
|
||
| Pacific | 0
|
-8
|
-3
|
58
|
24
|
3
|
||
| United States | 5
|
-8
|
-4
|
67
|
24
|
12
|
||
|
Note: HDD = heating degree-day; CDD = cooling degree-day Source: National Oceanic and Atmospheric Administration | ||||||||
Average temperature (°F)
7-Day Mean ending Sep 12, 2013
Source: NOAA/National Weather Service
Deviation between average and normal (°F)
7-Day Mean ending Sep 12, 2013
Source: NOAA/National Weather Service