In the News:
Northeast Heat Last Week Bumps Up Power Burn and Gas Prices
Extreme heat in the Northeast and Mid-Atlantic regions last week caused spikes in the price of wholesale natural gas and electric power, as well as near-record consumption of natural gas for power generation. Although recent pipeline capacity additions have helped ease movement of natural gas supplies in the area, constraints continue to limit gas flow to the region, particularly in times of high demand so typical of July and August.
The day-ahead price of natural gas at the Algonquin Citygate, which serves Boston consumers, rose to $8.09 per million British thermal unit (MMBtu) at the end of trading on July 16. This was its highest level since March, and more than $4 greater than the benchmark Henry Hub price ($3.69) in Louisiana. At Transcontinental Pipeline's Zone 6 trading point for delivery into New York City, prices rose to $5.59 per MMBtu the same day. The price of wholesale power in the Northeast increased along with wholesale natural gas prices; on New York's independent system operator's trading platform, real-time hourly wholesale power prices spiked to more than $800 per megawatt hour on July 17.
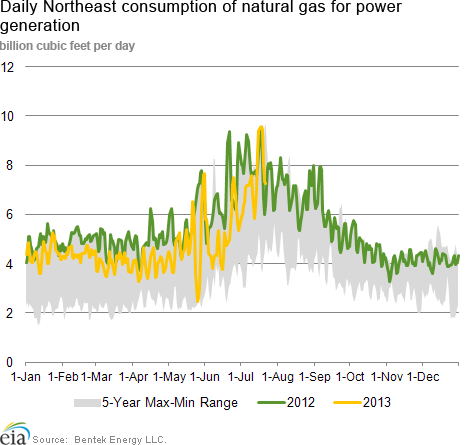
Reaching more than 9.5 billion cubic feet per day (Bcf/d) on July 17 and 18, natural gas used for electric power generation (power burn) came close to its record (for the 8 years for which data are available) of 9.7 Bcf, according to Bentek Energy estimates. This week, temperatures in the region are lower, and Bentek projects that power burn will average 5.8 Bcf/d over the next two weeks.
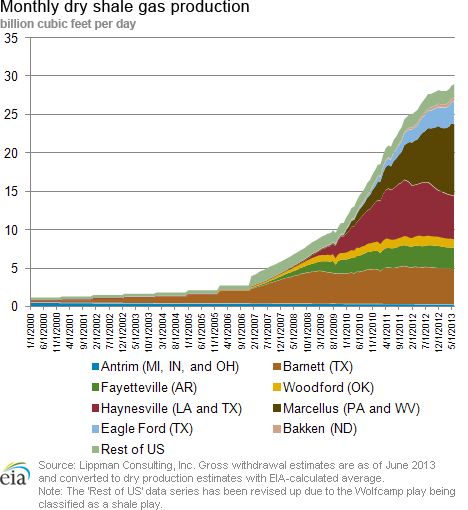
Consumption of natural gas for power generation has been higher this year than the previous five-year (2008-12) average, likely the result of significant declines in the Henry Hub price since 2008. This has contributed to an increase in the gas-fired share of total power generation.
Overview:
(For the Week Ending Wednesday, July 24, 2013)
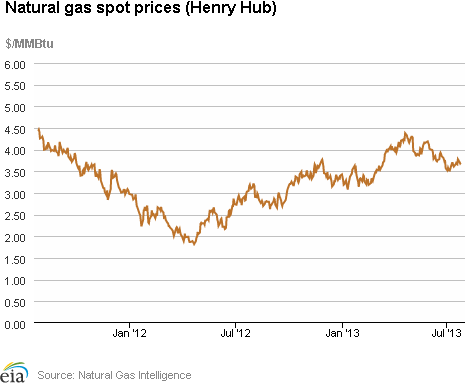
- Outside of the collapsing prices in the Northeast this week, natural gas spot prices remained relatively flat, with only little movement since last week (Wednesday, July 17, to Wednesday, July 24). The Henry Hub spot price ended the week at $3.70 per MMBtu yesterday, up 3 cents from $3.67 per MMBtu at the beginning of the report period.
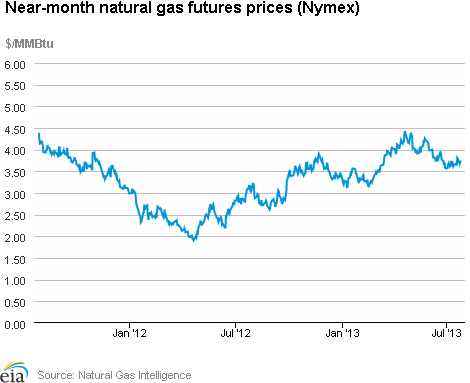
- At the New York Mercantile Exchange (Nymex), the price of the near-month (August 2013) contract rose almost 7 cents, from $3.629 per MMBtu last Wednesday to $3.698 yesterday.
- Working natural gas in storage increased to 2,786 Bcf as of Friday, July 19, according to the U.S. Energy Information Administration's (EIA) Weekly Natural Gas Storage Report (WNGSR). A net storage injection of 41 Bcf for the week resulted in storage levels 12.5% below year-ago levels and 1.6% below the 5-year average.
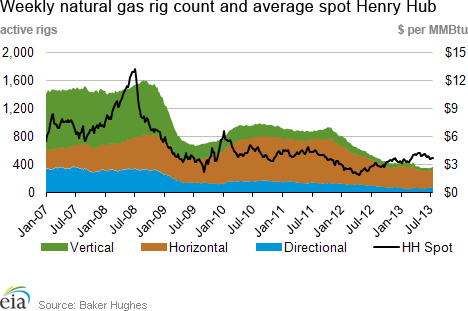
- The natural gas rotary rig count, as reported by Baker Hughes Incorporated, totaled 369 active units as of July 19, up 7 from the previous week. The oil rig count increased by 4 units to 1,395 rotary rigs.
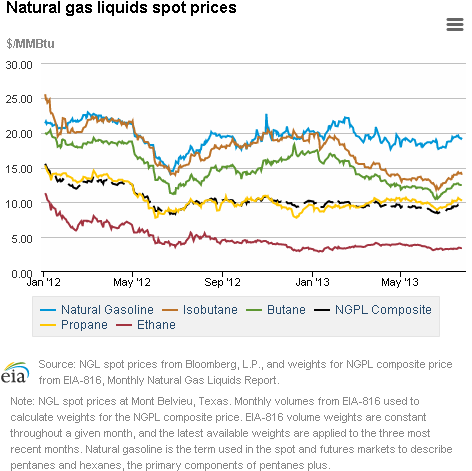
- The weekly average natural gas plant liquids composite price (covering July 15-19) increased 3% from the previous week to $9.53 per MMBtu. The average weekly Mont Belvieu spot prices for natural gasoline and ethane were up 2% each; butane, up 3%; and propane and isobutane, up 4% each.
Prices/Demand/Supply:
Prices fell over the report week in the Northeast as a heat wave subsided. With high temperatures reaching into the upper 90s in the beginning of the report week, the heat in the area drove up wholesale natural gas prices as demand for air conditioning; therefore, natural gas-fueled power generation, spiked. Prices at the Algonquin Citygate, which serves Boston, began the report week at $7.46 per MMBtu before falling back to $3.90 per MMBtu by Monday, and ending yesterday at $3.86 per MMBtu. Similarly, at Transcontinental Pipeline's Zone 6 trading point for delivery into New York City, prices dropped from $5.58 per MMBtu last Wednesday to $3.74 yesterday.
Despite intense heat across the rest of the country, price movements were uneventful. The Henry Hub spot price mostly remained flat over the week, rising from $3.67 per MMBtu last Wednesday to $3.70 yesterday. The Henry Hub price increased to $3.78 per MMBtu on Friday, July 19, heading into the hot weekend, but dropped back down to around $3.70 the following trading days. Most pricing points across the Lower 48 states posted single-digit declines or increases over the report week.
Nymex futures price increased 7 cents. Prices rose from $3.629 per MMBtu last Wednesday (July 17) to $3.698 yesterday. The price of the 12-month strip (the average of the 12 contracts between August 2013 and July 2014) rose from $3.827 per MMBtu last Wednesday to $3.888 per MMBtu yesterday.
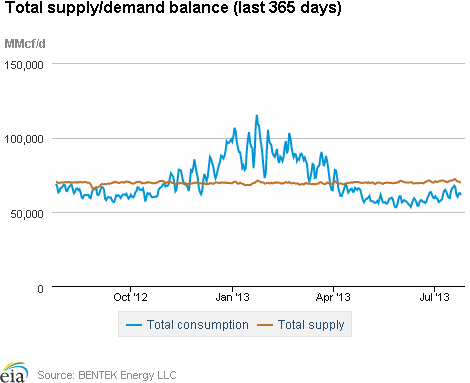
Supply increased very slightly over the report week. Dry production increased by 0.5%, offsetting a 4.3% decline in imports from Canada, according to data from Bentek. In the West and Northeast, pipeline imports were much higher in the first two days of the report week, likely to meet heat-related air conditioning demand, but fell during the remainder of the report week as weather moderated. Production this week was 3.1% greater than the year-ago level.
Consumption increased 0.6% over the report week. Consumption of natural gas for power generation increased less than 1% from the previous week, according to Bentek data. Despite high power consumption levels in the first few days of the report week, closer-to-normal power consumption in the following days led to a small overall weekly increase nationally. Regionally, power consumption increased 2.0% in both the Southeast and the Northeast, the two regions that consume the most natural gas for power generation. Electric power consumption in the Northeast this week exceeded its year-ago level by 4.5%, which is somewhat unusual, since low prices of summer 2012 led to record-high consumption of natural gas for power generation. Residential and commercial consumption increased slightly (though July is a month of minimal demand in these sectors), and industrial consumption remained flat. U.S. pipeline exports to Mexico increased 4.2%.
Storage
Working natural gas in storage increased to 2,786 Bcf as of Friday, July 19, according to EIA's WNGSR. Although the 41 Bcf gain in storage levels was higher than the 26 Bcf injection that occurred during the same week in 2012, it was lower than the 5-year average increase of 53 Bcf. Current inventories remain 399 Bcf (12.5%) less than last year at this time and 46 Bcf (1.6%) below the 5-year average of 2,832 Bcf.
All three storage regions posted increases this week. Net injections in the East and West regions were lower than their 5-year average injections, growing by 25 Bcf and 4 Bcf respectively. For the East region, this represented an injection that was 19 Bcf lower than the 5-year average injection for the week. The Producing region's net injection this week was 12 Bcf, which exceeded that region's 5-year average net injection of 3 Bcf. In that region, despite a decrease of 1 Bcf in salt cavern facilities, inventories in nonsalt cavern facilities grew by 12 Bcf.
The net injection was smaller than the market expectations, which on average were reported to be 46 Bcf. Despite the smaller-than-expected injection, natural gas prompt-month Nymex futures prices fell about $0.04 per MMBtu to just above $3.67 per MMBtu immediately following WNGSR's release. In the hour following the release, prices fell an additional $0.02 cents.
Warm temperatures during the storage report week supported this week's less than average net injection. Temperatures in the Lower 48 states were 2.0 degrees warmer than the 30-year normal temperature, 0.1 degrees cooler than the same period last year, and averaged 77.4 degrees for the week, compared to 77.6 degrees last year and the 30-year normal of 75.4 degrees.
See also:
| Spot Prices ($/MMBtu) | Thu, 18-Jul |
Fri, 19-Jul |
Mon, 22-Jul |
Tue, 23-Jul |
Wed, 24-Jul |
|---|---|---|---|---|---|
| Henry Hub |
3.66 |
3.78 |
3.71 |
3.68 |
3.70 |
| New York |
5.06 |
3.92 |
3.86 |
3.84 |
3.74 |
| Chicago |
3.85 |
3.87 |
3.74 |
3.77 |
3.81 |
| Cal. Comp. Avg,* |
3.74 |
3.83 |
3.75 |
3.76 |
3.82 |
| Futures ($/MMBtu) | |||||
| September Contract |
3.810 |
3.788 |
3.679 |
3.748 |
3.703 |
| October Contract |
3.819 |
3.796 |
3.691 |
3.760 |
3.717 |
| *Avg. of NGI's reported prices for: Malin, PG&E citygate, and Southern California Border Avg. | |||||
| Source: NGI's Daily Gas Price Index | |||||
| U.S. Natural Gas Supply - Gas Week: (7/17/13 - 7/24/13) | ||
|---|---|---|
Percent change for week compared with: |
||
last year |
last week |
|
| Gross Production | 3.08%
|
0.49%
|
| Dry Production | 3.05%
|
0.48%
|
| Canadian Imports | -15.94%
|
-4.28%
|
| West (Net) | 1.88%
|
-2.81%
|
| MidWest (Net) | -21.14%
|
-3.84%
|
| Northeast (Net) | -58.63%
|
-16.63%
|
| LNG Imports | -14.78%
|
-0.19%
|
| Total Supply | 1.26%
|
0.11%
|
| Source: BENTEK Energy LLC | ||
| U.S. Consumption - Gas Week: (7/17/13 - 7/24/13) | ||
|---|---|---|
Percent change for week compared with: |
||
last year |
last week |
|
| U.S. Consumption | -6.10%
|
0.44%
|
| Power | -12.24%
|
0.68%
|
| Industrial | 0.69%
|
0.00%
|
| Residential/Commercial | 3.59%
|
0.48%
|
| Total Demand | -5.35%
|
0.56%
|
| Source: BENTEK Energy LLC | ||
| Rigs | |||
|---|---|---|---|
Fri, July 19, 2013 |
Change from |
||
last week |
last year |
||
| Oil Rigs | 1,395 |
0.29% |
-1.34% |
| Natural Gas Rigs | 369 |
1.93% |
-28.76% |
| Miscellaneous | 6 |
0.00% |
100.00% |
| Rig Numbers by Type | |||
|---|---|---|---|
Fri, July 19, 2013 |
Change from |
||
last week |
last year |
||
| Vertical | 432 |
0.00% |
-20.15% |
| Horizontal | 1,058 |
0.00% |
-9.11% |
| Directional | 280 |
4.09% |
21.74% |
| Source: Baker Hughes Inc. | |||
| Working Gas in Underground Storage | ||||
|---|---|---|---|---|
Stocks billion cubic feet (bcf) |
||||
| Region | 7/19/13
|
7/12/13
|
change |
|
| East | 1,306 |
1,281 |
25
|
|
| West | 455 |
451 |
4
|
|
| Producing | 1,025 |
1,013 |
12
|
|
| Total | 2,786 |
2,745 |
41
|
|
| Source: U.S. Energy Information Administration | ||||
| Working Gas in Underground Storage | |||||
|---|---|---|---|---|---|
Historical Comparisons |
|||||
Year ago (7/19/12) |
5-year average (2008-2012) |
||||
| Region | Stocks (Bcf) |
% change |
Stocks (Bcf) |
% change |
|
| East | 1,572 |
-16.9 |
1,426 |
-8.4 |
|
| West | 494 |
-7.9 |
426 |
6.8 |
|
| Producing | 1,119 |
-8.4 |
980 |
4.6 |
|
| Total | 3,185 |
-12.5 |
2,832 |
-1.6 |
|
| Source: U.S. Energy Information Administration | |||||
| Temperature -- Heating & Cooling Degree Days (week ending Jul 18) | ||||||||
|---|---|---|---|---|---|---|---|---|
HDD deviation from: |
CDD deviation from: |
|||||||
| Region | HDD Current |
normal |
last year |
CDD Current |
normal |
last year |
||
| New England | 0
|
-1
|
0
|
84
|
42
|
8
|
||
| Middle Atlantic | 0
|
0
|
0
|
95
|
38
|
9
|
||
| E N Central | 1
|
0
|
1
|
86
|
29
|
-7
|
||
| W N Central | 0
|
-3
|
0
|
85
|
14
|
-14
|
||
| South Atlantic | 0
|
0
|
0
|
99
|
2
|
-1
|
||
| E S Central | 0
|
0
|
0
|
91
|
-3
|
-3
|
||
| W S Central | 0
|
0
|
0
|
111
|
-13
|
-6
|
||
| Mountain | 0
|
-4
|
0
|
88
|
10
|
5
|
||
| Pacific | 1
|
-3
|
1
|
51
|
8
|
-1
|
||
| United States | 0
|
-1
|
0
|
87
|
13
|
-1
|
||
|
Note: HDD = heating degree-day; CDD = cooling degree-day Source: National Oceanic and Atmospheric Administration | ||||||||
Average temperature (°F)
7-Day Mean ending Jul 18, 2013
Source: NOAA/National Weather Service
Deviation between average and normal (°F)
7-Day Mean ending Jul 18, 2013
Source: NOAA/National Weather Service