In the News:
FERC approves operation of new natural gas export pipeline to Mexico
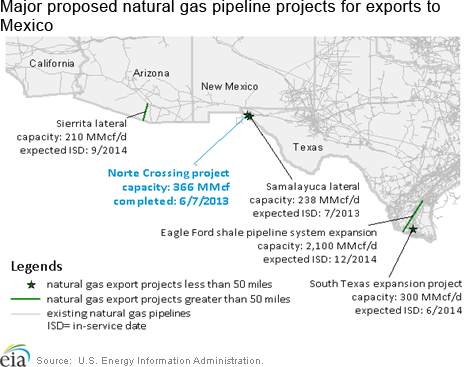
The United States later this summer will add close to 10% to its natural gas export capacity to Mexico following the June 14 approval of a 0.37 billion cubic feet per day (Bcf/d) pipeline that crosses the border at a point in far western Texas. The Federal Energy Regulatory Commission approved a request by Kinder Morgan's El Paso Natural Gas Co. to begin operations on the export pipeline that crosses the border from El Paso County, Texas.
Norte Crossing is one of several natural gas pipeline export projects planned through the end of 2014, which together could add up to 3.3 Bcf/d of additional export capacity to Mexico – almost doubling the 2012 U.S. export capacity to Mexico of 3.8 Bcf/d. U.S. exports of natural gas to Mexico have increased by 0.34 Bcf/d from March 2012 to March 2013, and now average 1.81 Bcf/d. The highest year-on-year increases in monthly export volumes to Mexico between 2012 and 2013 have come from three pipeline crossings immediately to the south of the Eagle Ford Shale play in the Western Gulf Basin of South Texas. The Norte Crossing differs in that it is located in the Permian Basin in West Texas.
Mexico has increasingly relied on pipeline gas imported from the United States because its natural gas consumption has risen faster than production. Much of the increased consumption is the result of the country's plans to add 28 gigawatts of new electric generating capacity between 2012 and 2027. Norte Crossing will interconnect with the 0.85 Bcf/d Chihuahua Corridor pipeline in Mexico, scheduled for completion this summer, according to Mexican government reports. This corridor will increase natural gas supply to electric generation facilities in Chihuahua and the neighboring states of Durango and Coahuila.
Overview:
(For the Week Ending Wednesday, June 19, 2013)
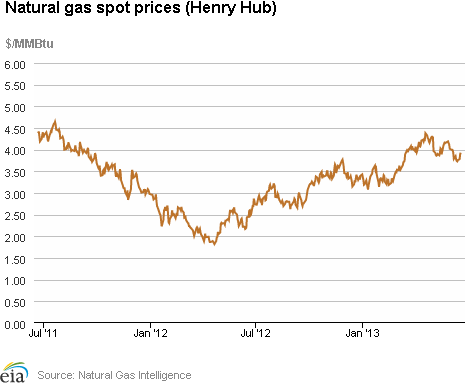
- Natural gas hub prices increased in most areas during the report week (Wednesday, June 12, to Wednesday, June 19). The Henry Hub spot price closed yesterday at $3.93 per million British thermal unit (MMBtu), up 19 cents from $3.74 the previous week.
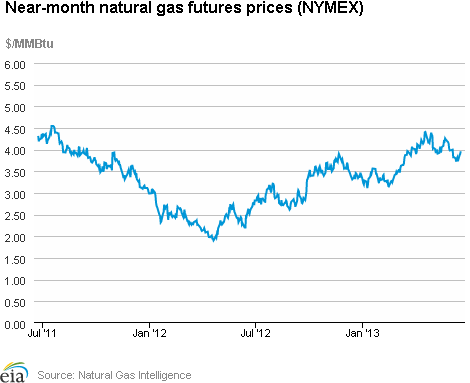
- At the Nymex, futures prices also increased over the week. The near-month contract (July 2013) rose from $3.777 per MMBtu to $3.963 per MMBtu yesterday.
- Working natural gas in storage increased to 2,438 billion cubic feet (Bcf) as of Friday, June 14, according to the U.S. Energy Information Administration's (EIA) Weekly Natural Gas Storage Report (WNGSR). A net storage injection of 91 Bcf for the week resulted in storage levels 18.7% below year-ago levels, and 1.9% below the 5-year average.
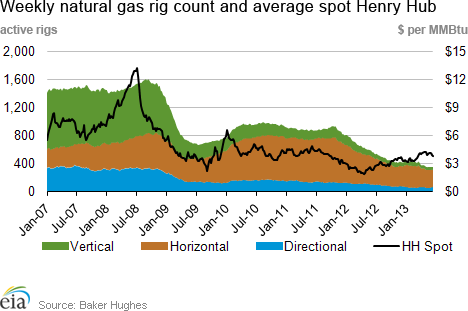
- The Baker Hughes natural gas rotary rig count totaled 353 active units as of Friday, June 14, a decline of 1 rig from the previous week. The oil rig count increased by 7 to 1,413.
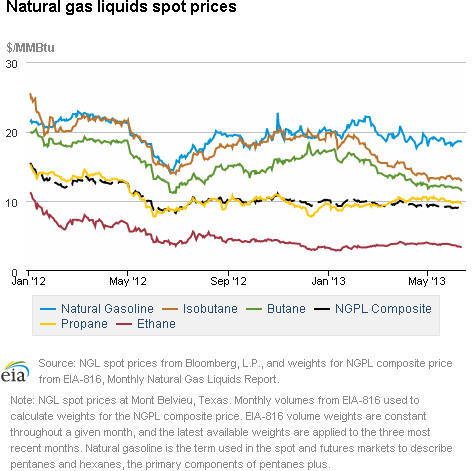
- The weekly average natural gas plant liquids composite price fell this week (covering June 10 through 14) compared to last week by 3%, and is now at $8.76 per MMBtu. Ethane and propane spot prices fell by 9% and 4% respectively, with weekly averages of $3.28 per MMBtu and $9.53 per MMBtu. Butane and isobutane spot prices similarly fell, decreasing by 5% and 3% respectively, to $11.39 per MMBtu and $12.83 per MMBtu. The natural gasoline spot price was up slightly for the week.
Prices/Demand/Supply:
Natural gas prices rose over the report week at most locations. The Henry Hub spot price increased from $3.74 last Wednesday to $3.93 yesterday, reversing some of the declines from previous weeks. Prices increased across most of the country, likely in response to forecasts for hot weather. Increases were particularly large in the Northeast, with large gains in trading Tuesday. The price at the Algonquin Citygate, which serves Boston, rose $0.24 to $3.97 per MMBtu. Similarly, prices at Transcontinental Pipeline's Zone 6 trading point for delivery into New York City rose $0.25 per MMBtu the same day. The Northeast is a major consumer of natural gas for power generation, and their consumption this week was about 2.4% greater than the previous week, with particularly high use on Monday and Tuesday, according to data from Bentek Energy Services.
A pipeline explosion Tuesday morning on Florida Gas Transmission's (FGT) system is expected to have little effect on prices. The explosion occurred in Washington Parish, Louisiana, and no injuries were reported. While prices at the FGT Zone 3 trading point have risen $0.17 per MMBtu since Monday, these increases are more or less consistent with other prices in the region. Various trade press sources have noted that the availability of spare capacity on pipelines in the region will offset the impact of the explosion. Bentek said in an analysis report that it does not expect further upward pressure on prices as a result of the explosion. The spot price at FGT ended the week at $4.18 per MMBtu.
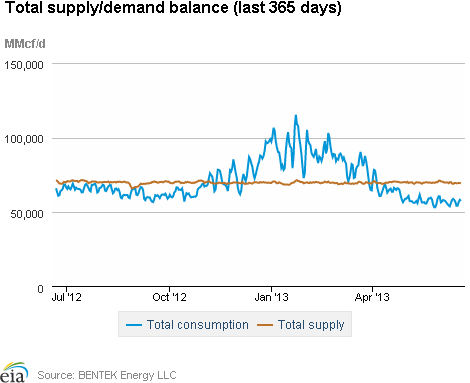
Total supply declined 0.5% during the week. According to Bentek data, dry gas production declined 0.6% during the week, as maintenance in several regions curtailed some production for the past several days. Despite the decline this week, production remains 1.2% above its year-ago level. Declines in production were partly offset by a 1.4% increase in Canadian imports week over week. Consumption increased 0.9% during the week. A 5.6% increase in power consumption was partially offset by decreases in industrial, residential, and commercial use. Power burn increased in most areas of the country. In the Southeast (the largest consumer of natural gas for power generation), consumption of natural gas for power generation increased 11.8%.
At the Nymex, the futures price rose during the week. The price of the July 2013 contract rose from $3.777 per MMBtu last Wednesday to $3.963 yesterday. The 12-month strip (the average of the 12 contracts between July 2013 and June 2014) increased from $3.949 per MMBtu last Wednesday to $4.097 yesterday.
Both short-term issues like end-user maintenance and long-term fundamental issues led to substantial declines in NGL prices. Williams Company shut down its olefins facility in Geismar, Louisiana, for unplanned maintenance Thursday following an explosion; additionally, CP Chemicals Group's Port Arthur, Texas, ethylene cracker is offline for planned maintenance. These events put downward pressure on ethane and butane prices. In addition to short-term maintenance outages, longer term fundamentals have also put downward pressure on prices, particularly on butane. Increases in supply, export constraints, and declines in gasoline demand (butane is used as a blending agent) have all led to price declines.
Storage
Working natural gas in storage increased to 2,438 Bcf as of Friday, June 14, according to EIA'sWNGSR. The 91 Bcf gain in storage levels was higher than both the 5-year average and year-ago stock changes for the week, which had net injections of 80 Bcf and 63 Bcf, respectively. Despite the large build, current inventories remain 559 Bcf (18.7%) less than last year at this time and 47 Bcf (1.9%) below the 5-year average of 2,485 Bcf.
The net injection was larger than the market expectations, which, on average, were reported to be 90 Bcf. Natural gas near-month Nymex futures prices fell $0.084 per MMBtu to $3.835 around the time of WNGSR's release. In the hour following the release, prices traded higher at $3.903 per MMBtu.
All three storage regions posted increases this week. Inventories in the East, West, and Producing regions increased by 60 Bcf (the 5-year average net injection is 52 Bcf), 11 Bcf (the 5-year average net injection is 13 Bcf), and 20 Bcf (the 5-year average net injection is 15 Bcf), respectively. In the Producing region, working natural gas inventories increased 2 Bcf (0.8%) in salt cavern facilities and increased 19 Bcf (2.9%) in nonsalt cavern facilities.
Warm temperatures during the storage report week supported this week's net injection. Temperatures in the Lower 48 states were 1.6 degrees warmer than the 30-year normal temperature and 0.9 degrees warmer than the same period last year, and averaged 71.0 degrees for the week, compared to 70.1 degrees last year and the 30-year normal of 69.4 degrees.
See also:
| Spot Prices ($/MMBtu) | Thu, 13-Jun |
Fri, 14-Jun |
Mon, 17-Jun |
Tue, 18-Jun |
Wed, 19-Jun |
|---|---|---|---|---|---|
| Henry Hub |
3.73 |
3.76 |
3.78 |
3.90 |
3.93 |
| New York |
3.74 |
3.64 |
3.89 |
3.98 |
4.01 |
| Chicago |
3.77 |
3.76 |
3.86 |
3.95 |
3.97 |
| Cal. Comp. Avg,* |
3.69 |
3.71 |
3.78 |
3.87 |
3.87 |
| Futures ($/MMBtu) | |||||
| July Contract |
3.814 |
3.733 |
3.875 |
3.905 |
3.963 |
| August Contract |
3.837 |
3.759 |
3.897 |
3.927 |
3.985 |
| *Avg. of NGI's reported prices for: Malin, PG&E citygate, and Southern California Border Avg. | |||||
| Source: NGI's Daily Gas Price Index | |||||
| U.S. Natural Gas Supply - Gas Week: (6/12/13 - 6/19/13) | ||
|---|---|---|
Percent change for week compared with: |
||
last year |
last week |
|
| Gross Production | 1.17%
|
-0.65%
|
| Dry Production | 1.16%
|
-0.65%
|
| Canadian Imports | -15.00%
|
1.42%
|
| West (Net) | -5.54%
|
2.07%
|
| MidWest (Net) | 8.22%
|
-0.23%
|
| Northeast (Net) | -113.08%
|
-17.64%
|
| LNG Imports | -52.04%
|
12.42%
|
| Total Supply | -0.59%
|
-0.46%
|
| Source: BENTEK Energy LLC | ||
| U.S. Consumption - Gas Week: (6/12/13 - 6/19/13) | ||
|---|---|---|
Percent change for week compared with: |
||
last year |
last week |
|
| U.S. Consumption | -7.60%
|
1.04%
|
| Power | -16.42%
|
5.56%
|
| Industrial | -0.05%
|
-0.35%
|
| Residential/Commercial | 3.03%
|
-5.56%
|
| Total Demand | -7.67%
|
0.90%
|
| Source: BENTEK Energy LLC | ||
| Rigs | |||
|---|---|---|---|
Fri, June 14, 2013 |
Change from |
||
last week |
last year |
||
| Oil Rigs | 1,413 |
0.50% |
0.57% |
| Natural Gas Rigs | 353 |
-0.28% |
-37.19% |
| Miscellaneous | 5 |
0.00% |
25.00% |
| Rig Numbers by Type | |||
|---|---|---|---|
Fri, June 14, 2013 |
Change from |
||
last week |
last year |
||
| Vertical | 441 |
0.46% |
-23.44% |
| Horizontal | 1,086 |
-0.18% |
-6.54% |
| Directional | 244 |
2.52% |
4.72% |
| Source: Baker Hughes Inc. | |||
| Working Gas in Underground Storage | ||||
|---|---|---|---|---|
Stocks billion cubic feet (bcf) |
||||
| Region | 6/14/13
|
6/7/13
|
change |
|
| East | 1,085 |
1,025 |
60
|
|
| West | 420 |
409 |
11
|
|
| Producing | 933 |
913 |
20
|
|
| Total | 2,438 |
2,347 |
91
|
|
| Source: U.S. Energy Information Administration | ||||
| Working Gas in Underground Storage | |||||
|---|---|---|---|---|---|
Historical Comparisons |
|||||
Year ago (6/14/12) |
5-year average (2008-2012) |
||||
| Region | Stocks (Bcf) |
% change |
Stocks (Bcf) |
% change |
|
| East | 1,438 |
-24.5 |
1,179 |
-8.0 |
|
| West | 445 |
-5.6 |
376 |
11.7 |
|
| Producing | 1,114 |
-16.2 |
930 |
0.3 |
|
| Total | 2,997 |
-18.7 |
2,485 |
-1.9 |
|
| Source: U.S. Energy Information Administration | |||||
| Temperature -- Heating & Cooling Degree Days (week ending Jun 13) | ||||||||
|---|---|---|---|---|---|---|---|---|
HDD deviation from: |
CDD deviation from: |
|||||||
| Region | HDD Current |
normal |
last year |
CDD Current |
normal |
last year |
||
| New England | 29
|
10
|
6
|
2
|
-7
|
-1
|
||
| Middle Atlantic | 11
|
-2
|
3
|
15
|
-6
|
-9
|
||
| E N Central | 13
|
-3
|
4
|
26
|
-3
|
-12
|
||
| W N Central | 16
|
1
|
9
|
34
|
-4
|
-14
|
||
| South Atlantic | 0
|
-3
|
-3
|
85
|
17
|
20
|
||
| E S Central | 0
|
-2
|
-2
|
77
|
15
|
21
|
||
| W S Central | 0
|
0
|
0
|
101
|
7
|
-3
|
||
| Mountain | 5
|
-22
|
-16
|
79
|
32
|
33
|
||
| Pacific | 6
|
-12
|
-8
|
29
|
10
|
19
|
||
| United States | 8
|
-5
|
0
|
50
|
6
|
6
|
||
|
Note: HDD = heating degree-day; CDD = cooling degree-day Source: National Oceanic and Atmospheric Administration | ||||||||
Average temperature (°F)
7-Day Mean ending Jun 13, 2013
Source: NOAA/National Weather Service
Deviation between average and normal (°F)
7-Day Mean ending Jun 13, 2013
Source: NOAA/National Weather Service