In the News:
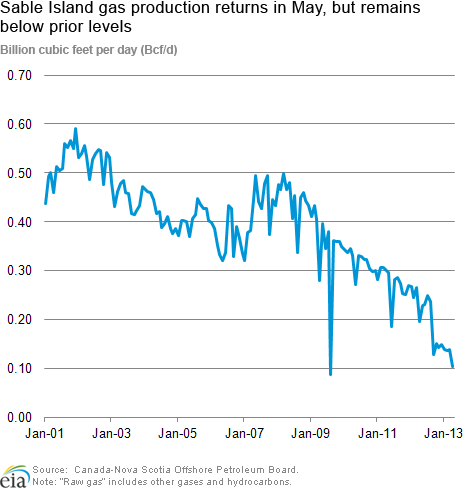
Island gas production returns in May, but remains below prior levels
After planned outage for maintenance that began on April 23, natural gas production resumed on May 6 at northeastern Canada's Sable Island Offshore production field, which is located 125 miles off the coast of Nova Scotia. Spectra Energy's Maritimes and Northeast Pipeline subsidiary Maritimes Canada announced the completion of the planned outage and a return to production on May 5. Spectra's pipeline brings offshore, onshore, and liquid natural gas to Nova Scotia, New Brunswick, and the northeastern United States.
Although Sable Island production resumed this month, it remains below prior levels. Through April, "raw gas" production from Sable Island for 2013 averaged 0.13 billion cubic feet per day (Bcf/d), according to data from the Canada-Nova Scotia Offshore Petroleum Board. This is 38 percent below the 0.21 Bcf/d of average raw gas production in 2012, and 68 percent below the 0.40 Bcf/d average for 2002-2011.
Sable Island's production has been down compared to prior levels throughout the course of 2013 due to operational issues with a subsea flow line connected to South Venture and Venture fields, according to industry reports. South Venture and Venture are two of the five offshore producing fields operated by the Sable Offshore Energy Project consortium (SOEP). Issues with this flow line have led to production declines at Sable since October 2012. Production at Encana's adjacent Deep Panuke offshore project could have offset some of the production loss at Sable Island, but this has not yet occurred due to the project's delayed start date. Production at Deep Panuke is now expected to begin in June 2013, according to a May 23 press release from project operator SBM Offshore, and produce up to 0.3 Bcf/d.
Overview:
(For the Week Ending Wednesday, May 29, 2013)
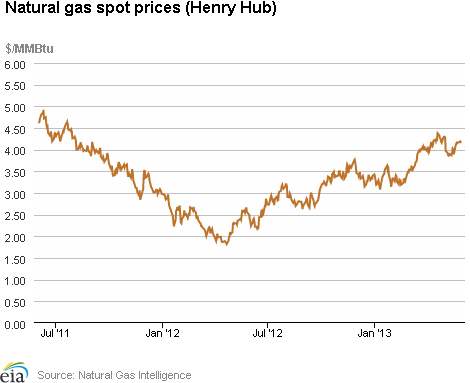
- With the exception of locations in the Northeast, natural gas spot prices were flat or slightly down at most trading locations during the report week (Wednesday, May 22 – Wednesday, May 29). The Henry Hub spot price decreased by $0.01 per million British thermal unit (MMBtu) from $4.16 per MMBtu last Wednesday to $4.15 per MMBtu yesterday.
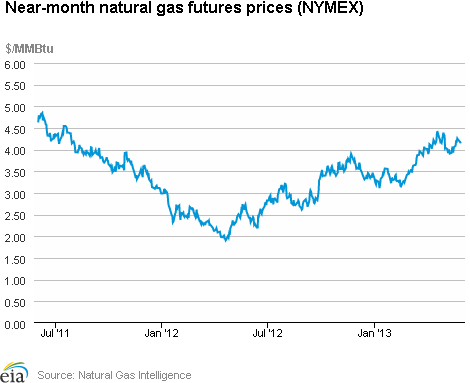
- At the New York Mercantile Exchange (Nymex), the price of the near-month (June 2013) natural gas futures contract fell slightly, moving from $4.186 per MMBtu last Wednesday to $4.148 per MMBtu yesterday.
- Working natural gas in storage increased to 2,141 billion cubic feet (Bcf) as of Friday, May 24, according to EIA's Weekly Natural Gas Storage Report (WNGSR). An implied storage injection of 88 Bcf for the week moved storage levels 664 Bcf below year-ago levels, and 88 Bcf below the 5-year average.
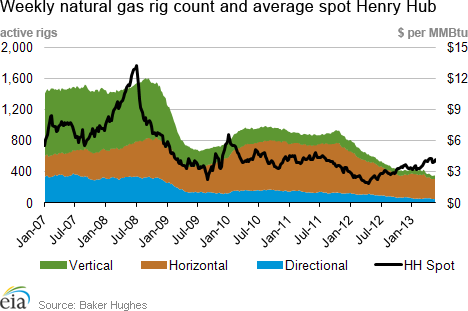
- The natural gas rotary rig count, as reported by Baker Hughes Incorporated, was flat at 354 as of Friday, May 24. The oil rig count fell by 6 units to 1,402.
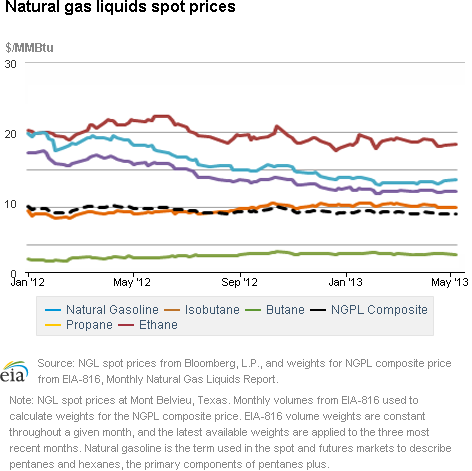
- The weekly average natural gas plant liquid composite price for last week (Monday, May 20 – Friday, May 24) decreased $0.05 per MMBtu over the previous week to $9.24 per MMBtu. Natural gasoline and propane spot prices were down by 2 percent and 1 percent, respectively, more than compensating for a 3 percent increase in the ethane spot price.
Prices:
For most locations, spot natural gas prices were almost flat or slightly down for the report week. The Henry Hub price fell by $0.01 per MMBtu to $4.15 per MMBtu yesterday. Both the SoCal and Chicago Citygate prices fell by $0.06 per MMBtu, ending the report week at $4.33 per MMBtu yesterday and $4.20 per MMBtu respectively. Hot weather yesterday pushed up demand for electricity for cooling, likely causing Northeastern prices to rise from Tuesday to Wednesday by $1.32 per MMBtu. Prices at the Algonquin Citygate, which serves Boston, went from $4.65 per MMBtu last Wednesday to $5.79 per MMBtu yesterday, an increase of $1.14 per MMBtu for the week. Prices at Transco Zone 6 New York, serving New York City, increased from $4.32 per MMBtu last Wednesday to $4.59 per MMBtu yesterday, an increase of $0.27 per MMBtu.
The Nymex futures price fell slightly over the report week.The June Nymex contract moved from $4.186 per MMBtu last Wednesday to $4.148 per MMBtu yesterday, a decrease of $0.038 per MMBtu. Similarly, the price of the 12-month strip (the average of June 2013 through May 2014 contracts) decreased from $4.333 per MMBtu to $4.283 per MMBtu yesterday, falling $0.05 per MMBtu.
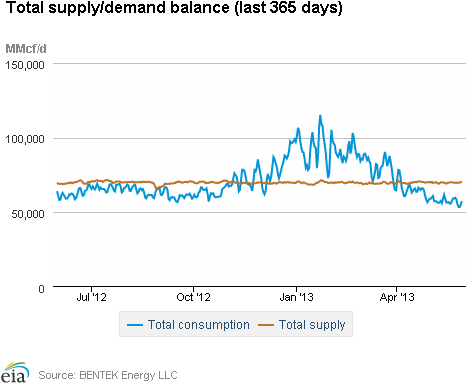
Total demand decreased during the report week. According to data from BENTEK Energy Services LLC, overall U.S. demand fell by 2.1 percent for the report week. Likely due to cool shoulder season weather for most of the week, consumption for natural gas in the electric sector fell by 16.8 percent. This week's natural gas consumption in the electric sector is 33.3 percent below year-ago levels. The Northeast and Northwest both faced temperatures as low as 40 degrees Fahrenheit during parts of the week, contributing to a 18.1 percent increase in consumption for natural gas in the residential/commercial sector. Industrial consumption is up 2.4 percent for the week.
Supply was essentially flat for the report week, falling by 0.1 percent. Dry gas production increased 0.5 percent from the previous week, and is 2.1 percent greater than this week last year. Canadian imports were down substantially, 7 percent lower for the week. The Northeast was a net exporter to Canada throughout the week.
Storage
Working natural gas in storage increased to 2,141 Bcf as of Friday, May 24, according to EIA's WNGSR. This represents an implied net injection of 88 Bcf from the previous week. Both the 5-year average and year-ago stock changes for the week were implied net injections of 92 Bcf and 72 Bcf, respectively. Inventories are currently 664 Bcf (23.7 percent) less than last year at this time and 88 Bcf (3.9 percent) below the 5-year average of 2,229 Bcf.
All three storage regions posted increases this week. Inventories in the East, West, and Producing regions increased by 53 Bcf (the 5-year average net injection is 52 Bcf), 12 Bcf (the 5-year average net injection is 14 Bcf), and 23 Bcf (the 5-year average net injection is 26 Bcf), respectively. In the Producing region, working natural gas inventories increased 4 Bcf (1.7 percent) in salt cavern facilities and increased 19 Bcf (3.2 percent) in nonsalt cavern facilities.
Temperatures during the storage report week were 4.0 degrees warmer than the 30-year normal temperature and 1.0 degree warmer than the same period last year. Temperatures in the Lower 48 states averaged 67.9 degrees, compared to 66.9 degrees last year and the 30-year normal of 63.9 degrees. During the week, all regions were warmer than normal, particularly the East North Central and Middle Atlantic Census divisions, which averaged 6.6 and 5.1 degrees, respectively, warmer than the 30-year normal. Heating degree-days nationwide were 48.5 percent below normal and 6.3 percent above last year.
See also:
| Spot Prices ($/MMBtu) | Thu, 23-May |
Fri, 24-May |
Mon, 27-May |
Tue, 28-May |
Wed, 29-May |
|---|---|---|---|---|---|
| Henry Hub | 4.15 |
4.16 |
Holiday |
4.19 |
4.15 |
| New York | 4.16 |
4.05 |
Holiday |
4.37 |
4.59 |
| Chicago | 4.24 |
4.19 |
Holiday |
4.19 |
4.20 |
| Cal. Comp. Avg,* | 4.12 |
4.08 |
Holiday |
4.12 |
4.13 |
| Futures ($/MMBtu) | |||||
| June Contract | 4.261 |
4.237 |
Holiday |
4.174 |
4.148 |
| July Contract | 4.307 |
4.284 |
Holiday |
4.224 |
4.184 |
| *Avg. of NGI's reported prices for: Malin, PG&E citygate, and Southern California Border Avg. | |||||
| Source: NGI's Daily Gas Price Index | |||||
| U.S. Natural Gas Supply - Gas Week: (5/22/13 - 5/29/13) | ||
|---|---|---|
Percent change for week compared with: |
||
last year |
last week |
|
| Gross Production | 2.13%
|
0.46%
|
| Dry Production | 2.11%
|
0.46%
|
| Canadian Imports | -18.32%
|
-6.96%
|
| West (Net) | -7.65%
|
-6.17%
|
| MidWest (Net) | 3.04%
|
-2.83%
|
| Northeast (Net) | -123.20%
|
239.31%
|
| LNG Imports | -65.62%
|
-3.09%
|
| Total Supply | -0.05%
|
-0.06%
|
| Source: BENTEK Energy LLC | ||
| U.S. Consumption - Gas Week: (5/22/13 - 5/29/13) | ||
|---|---|---|
Percent change for week compared with: |
||
last year |
last week |
|
| U.S. Consumption | -10.26%
|
-2.08%
|
| Power | -33.28%
|
-16.81%
|
| Industrial | 1.96%
|
2.37%
|
| Residential/Commercial | 26.31%
|
18.07%
|
| Total Demand | -9.56%
|
-1.97%
|
| Source: BENTEK Energy LLC | ||
| Rigs | |||
|---|---|---|---|
Fri, May 24, 2013 |
Change from |
||
last week |
last year |
||
| Oil Rigs | 1,402 |
-0.43% |
1.37% |
| Natural Gas Rigs | 354 |
0.00% |
-40.40% |
| Miscellaneous | 6 |
-14.29% |
0.00% |
| Rig Numbers by Type | |||
|---|---|---|---|
Fri, May 24, 2013 |
Change from |
||
last week |
last year |
||
| Vertical | 457 |
-1.08% |
-19.82% |
| Horizontal | 1,087 |
-0.82% |
-8.73% |
| Directional | 218 |
3.32% |
-1.80% |
| Source: Baker Hughes Inc. | |||
| Working Gas in Underground Storage | ||||
|---|---|---|---|---|
Stocks billion cubic feet (bcf) |
||||
| Region | 5/24/13
|
5/17/13
|
change |
|
| East | 910 |
857 |
53
|
|
| West | 380 |
368 |
12
|
|
| Producing | 851 |
828 |
23
|
|
| Total | 2,141 |
2,053 |
88
|
|
| Source: U.S. Energy Information Administration | ||||
| Working Gas in Underground Storage | |||||
|---|---|---|---|---|---|
Historical Comparisons |
|||||
Year ago (5/24/12) |
5-year average (2008-2012) |
||||
| Region | Stocks (Bcf) |
% change |
Stocks (Bcf) |
% change |
|
| East | 1,319 |
-31.0 |
1,020 |
-10.8 |
|
| West | 408 |
-6.9 |
333 |
14.1 |
|
| Producing | 1,078 |
-21.1 |
876 |
-2.9 |
|
| Total | 2,805 |
-23.7 |
2,229 |
-3.9 |
|
| Source: U.S. Energy Information Administration | |||||
| Temperature -- Heating & Cooling Degree Days (week ending May 23) | ||||||||
|---|---|---|---|---|---|---|---|---|
HDD deviation from: |
CDD deviation from: |
|||||||
| Region | HDD Current |
normal |
last year |
CDD Current |
normal |
last year |
||
| New England | 33
|
-18
|
-1
|
5
|
3
|
5
|
||
| Middle Atlantic | 17
|
-22
|
-3
|
21
|
14
|
17
|
||
| E N Central | 15
|
-30
|
-13
|
30
|
16
|
15
|
||
| W N Central | 30
|
-10
|
10
|
19
|
2
|
-6
|
||
| South Atlantic | 1
|
-14
|
-3
|
61
|
16
|
14
|
||
| E S Central | 1
|
-13
|
-1
|
58
|
23
|
12
|
||
| W S Central | 2
|
-1
|
1
|
90
|
27
|
21
|
||
| Mountain | 39
|
-14
|
14
|
26
|
2
|
-16
|
||
| Pacific | 26
|
-8
|
14
|
5
|
-3
|
-9
|
||
| United States | 17
|
-16
|
1
|
37
|
12
|
8
|
||
|
Note: HDD = heating degree-day; CDD = cooling degree-day Source: National Oceanic and Atmospheric Administration | ||||||||
Average temperature (°F)
7-Day Mean ending May 23, 2013
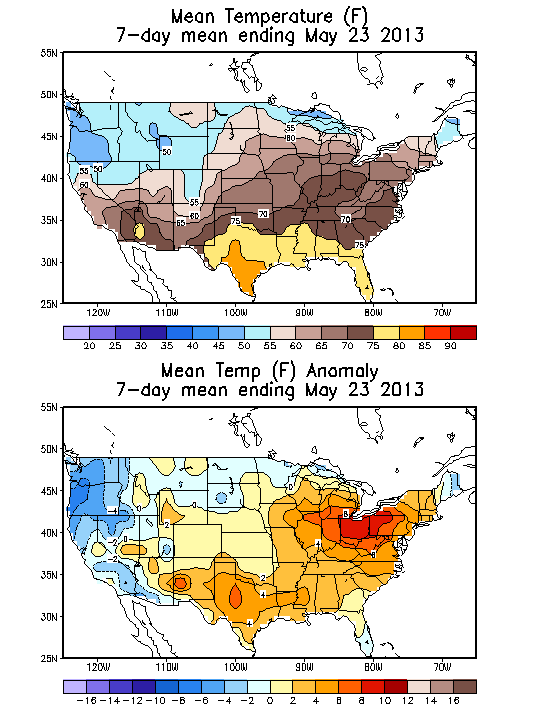
Source: NOAA/National Weather Service
Deviation between average and normal (°F)
7-Day Mean ending May 23, 2013
Source: NOAA/National Weather Service