In the News:
In the News: April-September cooling degree days up 4 percent in revised STEO forecast
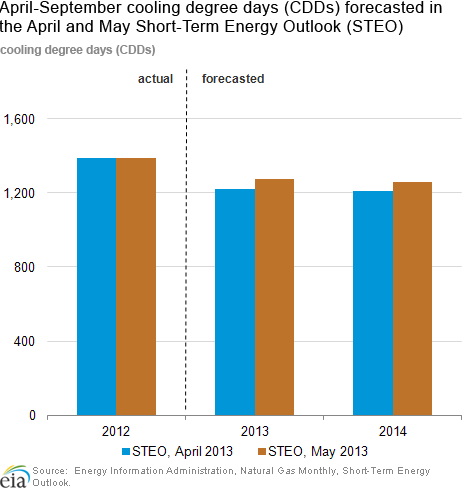
The U.S. Energy Information Administration (EIA)'s May 2013 Short-Term Energy Outlook (STEO) forecasts 1,273 CDDs for April-September 2013, 4.3 percent more than in the April 2013 STEO, and 1,257 CDDs for April-September 2014, an upward revision of 4.1 percent. Both of these revised totals remain below the 1,390 CDDs recorded during a seasonably warm April-September 2012. Typically, around 90 percent of the CDDs for a given year occur during the April-September period.
The May 2013 STEO uses data from the National Oceanic and Atmospheric Administration (NOAA) Climate Prediction Center's April 2013 degree-day outlook. This was the first month NOAA benchmarked its forecasts off of average temperatures from 1981-2010, and used population weights based on data from the 2010 U.S. Census. Previously, NOAA benchmarked its forecasts off of average temperatures from 1971-2000, and calculated population weights using data from the 2000 U.S. Census. This led to an upward revision of STEO's CDD forecast, and a downward revision in its forecast for heating degree days (HDDs).
As a result, the May 2013 STEO forecast contains an increase over the April 2013 STEO forecast in electric generation from all sources of 0.6 percent for April-September 2013 and 0.7 percent for April-September 2014. At the same time, it also revises up the projected Henry Hub spot price by almost 11 percent for both of these periods. So, although this month's STEO forecasts more CDDs in April-September 2013 and 2014, and therefore more electric generation, it revises downward the forecasted amount of natural gas consumed for electric generation by 1.1 percent for April-September 2013, and 2.8 percent for April-September 2014 as a result of higher prices.
Overview:
(For the Week Ending Wednesday, May 22, 2013)
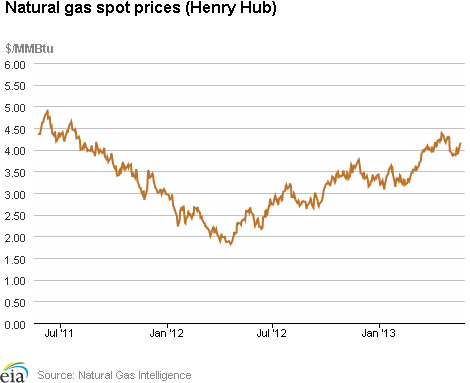
- Natural gas spot prices increased at most trading locations during the report week (Wednesday, May 15 – Wednesday, May 22). The Henry Hub spot price increased from $4.03 per million British thermal unit (MMBtu) last Wednesday to $4.16 per MMBtu yesterday.
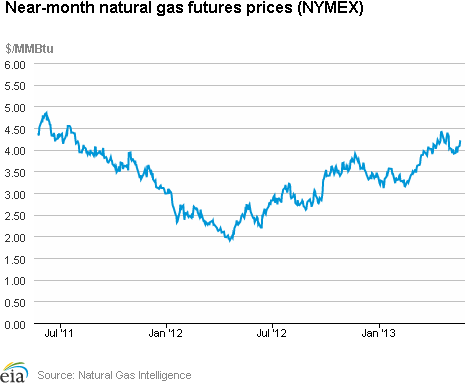
- At the New York Mercantile Exchange (Nymex), the price of the near-month (June 2013) natural gas futures contract increased from $4.070 per MMBtu last Wednesday to $4.186 per MMBtu yesterday.
- Working natural gas in storage increased to 2,053 billion cubic feet (Bcf) as of Friday, May 17, according to EIA's Weekly Natural Gas Storage Report (WNGSR). An implied storage injection of 89 Bcf for the week moved storage levels 680 Bcf below year-ago levels, and 84 Bcf below the 5-year average.
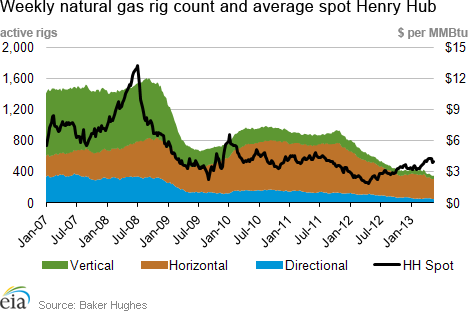
- The natural gas rotary rig count, as reported by Baker Hughes Incorporated, increased by 4 units to 354 as of Friday, May 17. The oil rig count fell by 4 units to 1,408.
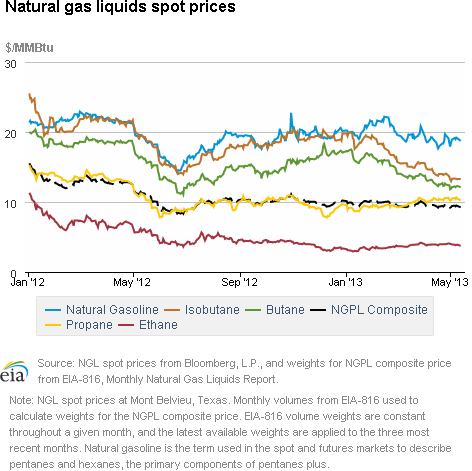
- The weekly average natural gas plant liquid composite price for last week (Monday, May 11 – Friday, May 17) decreased 15 cents per MMBtu, or about 2 percent, over the previous week to $9.29 per MMBtu. Ethane and propane spot prices are both down 2 percent for the week, driving the decrease in the composite price.
Prices:
Spot natural gas prices generally increased during the report week. The prices increased most significantly after the weekend, when they rose between 20 cents and 40 cents per MMBtu at most major trading hubs as warmer weather took hold. The Henry Hub price increased 13 cents to $4.16 per MMBtu yesterday from last Wednesday.
The price of the NYMEX June 2013 near-month contract increased from $4.070 per MMBtu to $4.186 per MMBtu during the report week. Similarly, the price of the 12-month strip (the average of the 12 contracts between June 2013 and May 2014) increased by 12 cents to $4.333 per MMBtu on May 22 from last Wednesday.
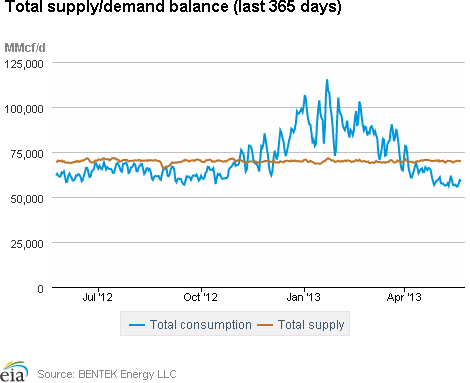
Total demand decreased during the report week, with increases in power burn offsetting declines in residential, commercial, and industrial consumption. Natural gas consumed for power generation increased 17.5 percent from last week, according to data from BENTEK Energy Services LLC. Power burn rose most significantly in the Midwest, Southeast, and Texas by 63 percent, 23 percent, and 30 percent, respectively. Warmer temperatures in the eastern United States likely contributed to higher natural gas consumption for power generation in these regions. In contrast, power burn in the Rockies, Pacific Northwest, and Southwest decreased by 20 percent, 15 percent, and 13 percent, respectively. Residential and commercial consumption declined 23.1 percent, as heating demand decreased, as can occur during shoulder months; industrial consumption declined 2.6 percent.
Supply rose slightly during the report week driven by increased natural gas production. Dry gas production increased 0.2 percent from the previous week, and is 2.2 percent greater than the same time in 2012. Natural gas pipeline and LNG imports increased slightly from the previous week but remain 2.6 percent and 60.9 percent below the same week in 2012, respectively.
Storage
Working natural gas in storage increased to 2,053 Bcf as of Friday, May 17, according to EIA's WNGSR. This represents an implied net injection of 89 Bcf from the previous week. Both the 5-year average and year-ago stock changes for the week were implied net injections of 90 Bcf and 75 Bcf, respectively. Inventories are currently 680 Bcf (24.9 percent) less than last year at this time and 84 Bcf (3.9 percent) below the 5-year average of 2,137 Bcf.
All three storage regions posted increases this week. Inventories in the East, West, and Producing regions increased by 46 Bcf (the 5-year average net injection is 52 Bcf), 11 Bcf (the 5-year average net injection is 13 Bcf), and 32 Bcf (the 5-year average net injection is 25 Bcf), respectively. In the Producing region, working natural gas inventories increased 11 Bcf (4.8 percent) in salt cavern facilities and increased 20 Bcf (3.5 percent) in nonsalt cavern facilities.
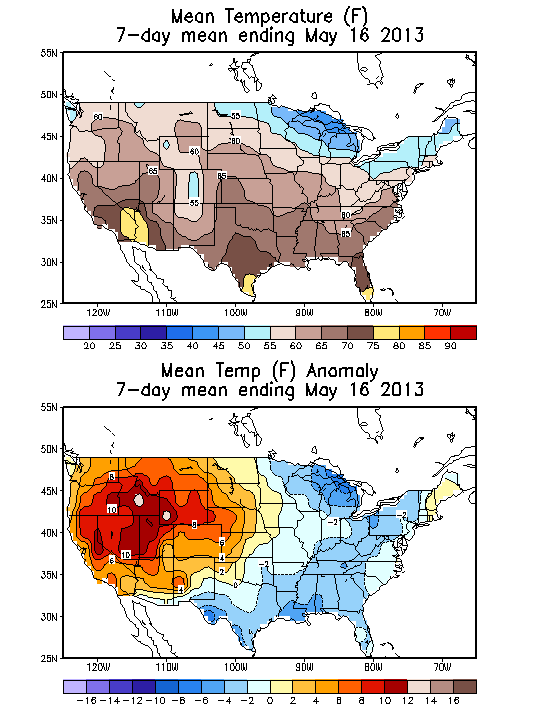
Temperatures during the storage report week were 1.0 degree warmer than the 30-year normal temperature and 1.0 degree cooler than the same period last year. Temperatures in the Lower 48 states averaged 62.3 degrees, compared to 63.3 degrees last year and the 30-year normal of 61.3 degrees. While overall temperatures were a degree warmer than normal, temperatures varied somewhat across Census divisions. In the West, the Mountain and Pacific Census divisions were significantly warm, averaging 8.1 and 6.9 degrees warmer, respectively, than the 30-year normal. In contrast, the East South Central Census division in the South and the East North Central Census division in the Midwest were relatively cool, averaging 2.1 and 2.0 degrees cooler, respectively, than the 30-year normal. Heating degree-days nationwide were 9.1 percent below normal and 37.9 percent above last year.
See also:
| Spot Prices ($/MMBtu) | Thu, 16-May |
Fri, 17-May |
Mon, 20-May |
Tue, 21-May |
Wed, 22-May |
|---|---|---|---|---|---|
| Henry Hub | 4.01 |
3.89 |
4.09 |
4.13 |
4.16 |
| New York | 4.13 |
3.96 |
4.35 |
4.45 |
4.32 |
| Chicago | 4.09 |
3.94 |
4.19 |
4.23 |
4.26 |
| Cal. Comp. Avg,* | 4.00 |
3.86 |
4.15 |
4.17 |
4.16 |
| Futures ($/MMBtu) | |||||
| June Contract | 3.932 |
4.055 |
4.090 |
4.192 |
4.186 |
| July Contract | 3.982 |
4.103 |
4.141 |
4.239 |
4.233 |
| *Avg. of NGI's reported prices for: Malin, PG&E citygate, and Southern California Border Avg. | |||||
| Source: NGI's Daily Gas Price Index | |||||
| U.S. Natural Gas Supply - Gas Week: (5/15/13 - 5/22/13) | ||
|---|---|---|
Percent change for week compared with: |
||
last year |
last week |
|
| Gross Production | 2.22%
|
0.22%
|
| Dry Production | 2.20%
|
0.22%
|
| Canadian Imports | -2.57%
|
0.09%
|
| West (Net) | -4.80%
|
-6.24%
|
| MidWest (Net) | 25.23%
|
8.51%
|
| Northeast (Net) | -110.75%
|
189.08%
|
| LNG Imports | -60.93%
|
8.46%
|
| Total Supply | 1.37%
|
0.23%
|
| Source: BENTEK Energy LLC | ||
| U.S. Consumption - Gas Week: (5/15/13 - 5/22/13) | ||
|---|---|---|
Percent change for week compared with: |
||
last year |
last week |
|
| U.S. Consumption | -4.55%
|
-1.61%
|
| Power | -7.22%
|
17.51%
|
| Industrial | -1.70%
|
-2.60%
|
| Residential/Commercial | -3.49%
|
-23.10%
|
| Total Demand | -3.96%
|
-1.54%
|
| Source: BENTEK Energy LLC | ||
| Rigs | |||
|---|---|---|---|
Fri, May 17, 2013 |
Change from |
||
last week |
last year |
||
| Oil Rigs | 1,408 |
-0.28% |
1.88% |
| Natural Gas Rigs | 354 |
1.14% |
-41.00% |
| Miscellaneous | 7 |
0.00% |
75.00% |
| Rig Numbers by Type | |||
|---|---|---|---|
Fri, May 17, 2013 |
Change from |
||
last week |
last year |
||
| Vertical | 462 |
-2.12% |
-18.37% |
| Horizontal | 1,096 |
-0.27% |
-8.13% |
| Directional | 211 |
6.57% |
-7.05% |
| Source: Baker Hughes Inc. | |||
| Working Gas in Underground Storage | ||||
|---|---|---|---|---|
Stocks billion cubic feet (bcf) |
||||
| Region | 5/17/13
|
5/10/13
|
change |
|
| East | 857 |
811 |
46
|
|
| West | 368 |
357 |
11
|
|
| Producing | 828 |
796 |
32
|
|
| Total | 2,053 |
1,964 |
89
|
|
| Source: U.S. Energy Information Administration | ||||
| Working Gas in Underground Storage | |||||
|---|---|---|---|---|---|
Historical Comparisons |
|||||
Year ago (5/17/12) |
5-year average (2008-2012) |
||||
| Region | Stocks (Bcf) |
% change |
Stocks (Bcf) |
% change |
|
| East | 1,275 |
-32.8 |
968 |
-11.5 |
|
| West | 397 |
-7.3 |
319 |
15.4 |
|
| Producing | 1,061 |
-22.0 |
850 |
-2.6 |
|
| Total | 2,733 |
-24.9 |
2,137 |
-3.9 |
|
| Source: U.S. Energy Information Administration | |||||
| Temperature -- Heating & Cooling Degree Days (week ending May 16) | ||||||||
|---|---|---|---|---|---|---|---|---|
HDD deviation from: |
CDD deviation from: |
|||||||
| Region | HDD Current |
normal |
last year |
CDD Current |
normal |
last year |
||
| New England | 64
|
-3
|
22
|
0
|
0
|
0
|
||
| Middle Atlantic | 58
|
4
|
25
|
1
|
-2
|
0
|
||
| E N Central | 71
|
12
|
26
|
7
|
-2
|
6
|
||
| W N Central | 51
|
0
|
12
|
15
|
4
|
10
|
||
| South Atlantic | 27
|
6
|
9
|
36
|
0
|
-5
|
||
| E S Central | 30
|
10
|
10
|
21
|
-5
|
-3
|
||
| W S Central | 7
|
2
|
0
|
41
|
-11
|
4
|
||
| Mountain | 26
|
-39
|
-26
|
36
|
18
|
9
|
||
| Pacific | 8
|
-33
|
-2
|
22
|
15
|
15
|
||
| United States | 40
|
-4
|
11
|
21
|
3
|
4
|
||
|
Note: HDD = heating degree-day; CDD = cooling degree-day Source: National Oceanic and Atmospheric Administration | ||||||||
Average temperature (°F)
7-Day Mean ending May 16, 2013
Source: NOAA/National Weather Service
Deviation between average and normal (°F)
7-Day Mean ending May 16, 2013
Source: NOAA/National Weather Service