In the News:
Natural gas liquids price information added to the Natural Gas Weekly Upd
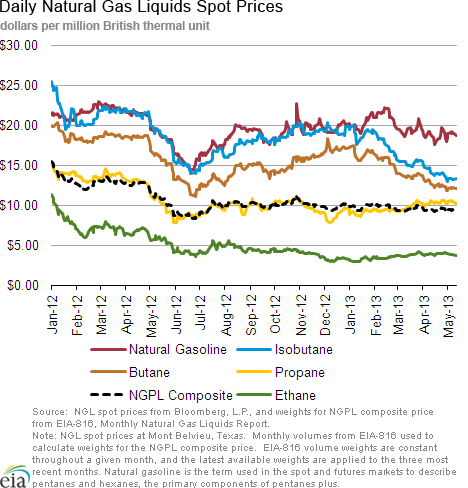
Starting today, the Natural Gas Weekly Update will include a graph and a brief text overview of natural gas liquids (NGL) spot prices for five products: ethane, propane, butane, isobutane, and natural gasoline, as well as a volume-weighted composite of these prices. The natural gas plant liquids (NGPL) composite price is calculated by applying the proportionate yield of liquids produced at natural gas processing plants to the daily spot prices. Next week's Natural Gas Weekly Update will feature the NGL graph above as a tab alongside the other price graphs.
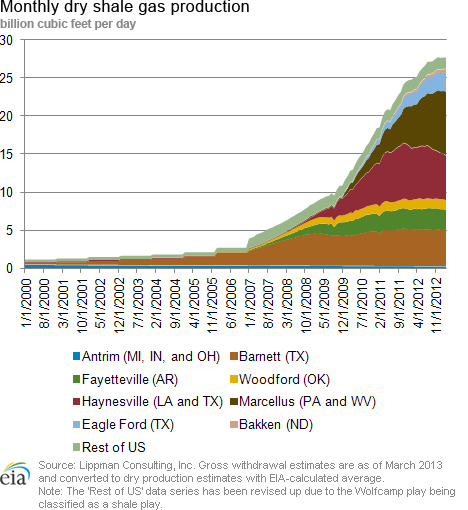
In recent years, low natural gas prices and high crude oil prices have led natural gas producers to target wet gas resources that contain a higher NGL content relative to dry natural gas. Heavy NGL (butane, isobutane, and natural gasoline) are primarily used as gasoline blendstock, and diluent for Canadian heavy crude exports to the United States. Accordingly, they are priced in relation to crude oil and tend to track it quite closely. Light NGL (ethane and propane) are typically priced closer to natural gas. Because of recent high levels of natural gas production, and levels of demand that have not been commensurate with production, the prices of light NGL products fell substantially in early 2012, and have remained relatively flat since.
The average NGPL composite price for the first quarter of 2013 was $9.78 per million British thermal unit (MMBtu), down $3.36 per MMBtu, or 26 percent, relative to the first quarter of 2012. Ethane and propane, which combined make up about 70 percent of NGPL production, have driven this decrease. The first quarter ethane spot price was down 54 percent relative to the first quarter last year, and the first quarter propane spot price was down 31 percent.
Overview:
(For the Week Ending Wednesday, May 15, 2013)
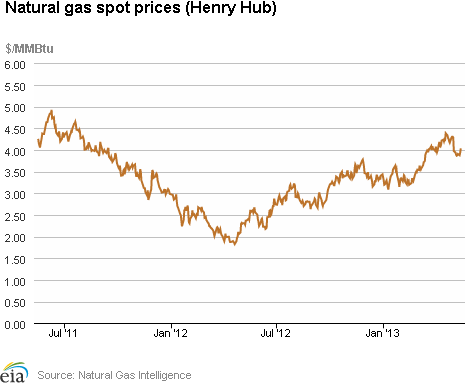
- Natural gas spot and futures prices generally increased at most trading locations during the report week (Wednesday, May 8 – Wednesday, May 15). The Henry Hub spot price increased from $3.86 per MMBtu last Wednesday to $4.03 per MMBtu yesterday/
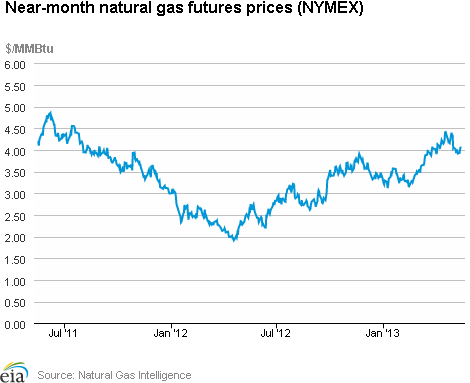
- At the New York Mercantile Exchange (Nymex), the price of the near-month (June 2013) natural gas futures contract increased from $3.978 per MMBtu last Wednesday to $4.070 per MMBtu yesterday.
- Working natural gas in storage increased to 1,964 billion cubic feet (Bcf) as of Friday, May 10, according to the U.S. Energy Information Administration's (EIA) Weekly Natural Gas Storage Report (WNGSR). An implied storage injection of 99 Bcf for the week moved storage levels 694 Bcf below year-ago levels, and 83 Bcf below the 5-year average.
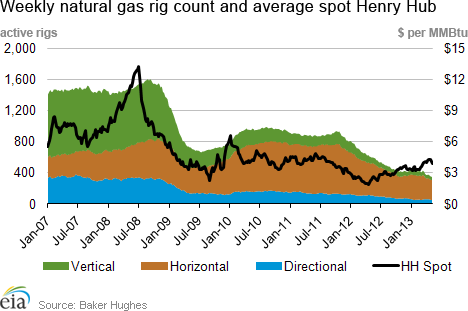
- The natural gas rotary rig count, as reported by Baker Hughes Incorporated, decreased by 4 units to 350 as of Friday, May 10. The oil rig count rose by 9 units to 1,412.
- The average NGPL composite price increased about 6 cents, or about 1 percent, over last week to $9.44 per MMBtu.
Prices:
Spot and futures prices generally increased during the report week. The Henry Hub price rose 17 cents from $3.86 per MMBtu last Wednesday to $4.03 per MMBtu yesterday, reversing some of the 40 cent loss posted last week. Prices oscillated through the week with ups and downs of a few cents, before rising 10 cents from $3.93 to $4.03 per MMBtu from Tuesday to Wednesday. Price increases across the country, particularly those that occurred at the end of the report week, may have reflected warm temperatures and air-conditioning demand in parts of the country.
The price of the NYMEX June 2013 near-month contract increased from $3.978 per MMBtu to $4.070 per MMBtu during the report week. Prices edged up after dropping down to $3.910 per MMBtu on Friday, May 10. The price of the 12-month strip (the average of the 12 contracts between June 2013 and May 2014) increased from $4.173 on May 8 to $4.214 on May 15. The largest gains were concentrated in the early months of the strip, while the April and May 2014 contracts posted small declines on the week.
NGPL prices increased slightly over last week. The average NGPL price this week was $9.44 per MMBtu, up 6 cents per MMBtu, or about 1 percent, over last week, and down $1.81 per MMBtu, or 16 percent, relative to this week last year. The NGPL price was pushed up this week by increases in the price of natural gasoline, propane, and butane, which are up 3 percent, 1 percent, and 1 percent, respectively. The ethane price is down slightly, falling 3 percent since last week.
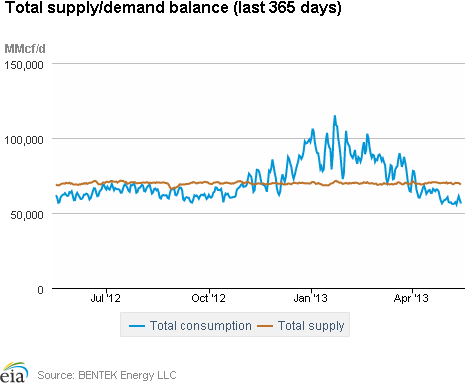
Total demand was relatively flat during the report week, with increases in power burn offsetting declines in residential, commercial, and industrial consumption. Consumption of natural gas for power generation increased 9.7 percent from last week, according to data from BENTEK Energy Services LLC. Power burn in the Southeast, Northeast, and Texas (the three largest natural-gas consuming regions in the electric power sector) increased by 10.3 percent, 11.9 percent, and 4.1 percent, respectively. Residential and commercial consumption declined 7.4 percent, as heating demand tapered off with more spring-like weather; and industrial consumption declined 1.5 percent. Exports to Mexico were flat. Relative to last year, total consumption this week was lower by 4.5 percent, largely driven by a 19.7 percent lower power burn level.
Supply was also flat this week, as production increased 0.1 percent and pipeline imports from Canada declined by 3 percent. The decline in net pipeline imports from Canada (5.0 Bcf per day to 4.8 Bcf per day) was relatively small volumetrically and did not make a large dent in the supply picture. Dry production increased 0.1 percent from the previous week, and is 2.3 percent greater than the same time in 2012.
Storage
Working natural gas in storage increased to 1,964 Bcf as of Friday, May 10, according to EIA's WNGSR. This represents an implied net injection of 99 Bcf from the previous week. Both the 5-year average and year-ago stock changes for the week were implied net injections of 83 Bcf and 56 Bcf, respectively. Inventories are currently 694 Bcf (26.1 percent) less than last year at this time and 83 Bcf (4.1 percent) below the 5-year average of 2,047 Bcf.
All three storage regions posted increases this week. Inventories in the East, West, and Producing regions increased by 55 Bcf (the 5-year average net injection is 51 Bcf), 13 Bcf (the 5-year average net injection is 12 Bcf), and 31 Bcf (the 5-year average net injection is 20 Bcf), respectively. In the Producing region, working natural gas inventories increased 16 Bcf (7.5 percent) in salt cavern facilities and increased 16 Bcf (2.9 percent) in nonsalt cavern facilities.
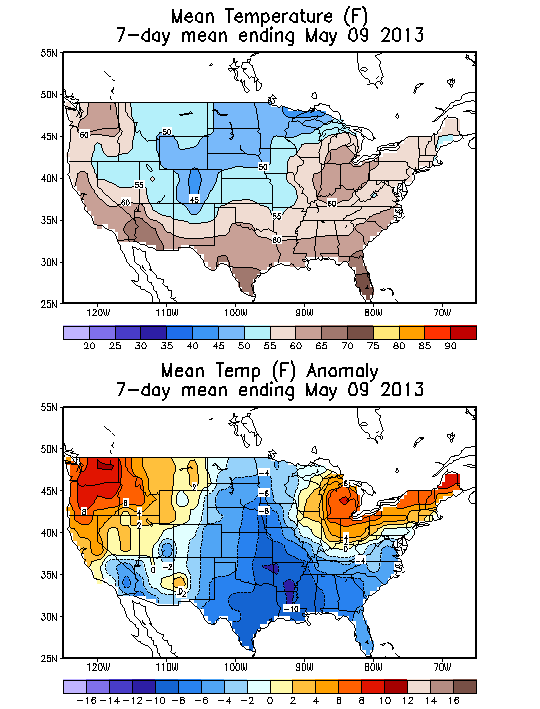
Temperatures during the storage report week were normal, but 6.1 degrees cooler than the same period last year. Temperatures in the Lower 48 states averaged 59.1 degrees, the same as the 30-year normal, but 6.1 degrees cooler than last year's level of 65.3 degrees. While overall temperatures were normal, temperatures varied somewhat across Census divisions. The West South Central Census division in the South and the West North Central Census division in the Midwest were relatively cool, averaging 8.3 and 5.6 degrees cooler, respectively, than the 30-year normal. In contrast, the East North Central Census division in the Midwest was relatively warm, averaging 4.3 degrees warmer than the 30-year normal. Heating degree-days nationwide were 10.9 percent below normal and 69.0 percent above last year.
See also:
| Spot Prices ($/MMBtu) | Thu, 09-May |
Fri, 10-May |
Mon, 13-May |
Tue, 14-May |
Wed, 15-May |
|---|---|---|---|---|---|
| Henry Hub | 3.87 |
3.90 |
3.87 |
3.93 |
4.03 |
| New York | 4.04 |
4.02 |
4.13 |
4.12 |
4.17 |
| Chicago | 4.04 |
4.02 |
3.99 |
4.04 |
4.13 |
| Cal. Comp. Avg,* | 3.91 |
3.89 |
3.94 |
3.99 |
4.06 |
| Futures ($/MMBtu) | |||||
| June Contract | 3.983 |
3.910 |
3.925 |
4.024 |
4.070 |
| July Contract | 4.033 |
3.960 |
3.971 |
4.068 |
4.113 |
| *Avg. of NGI's reported prices for: Malin, PG&E citygate, and Southern California Border Avg. | |||||
| Source: NGI's Daily Gas Price Index | |||||
| U.S. Natural Gas Supply - Gas Week: (5/8/13 - 5/15/13) | ||
|---|---|---|
Percent change for week compared with: |
||
last year |
last week |
|
| Gross Production | 2.34%
|
0.06%
|
| Dry Production | 2.31%
|
0.06%
|
| Canadian Imports | -0.05%
|
-2.96%
|
| West (Net) | 5.34%
|
-1.80%
|
| MidWest (Net) | 11.85%
|
-7.90%
|
| Northeast (Net) | -103.33%
|
-88.89%
|
| LNG Imports | -59.68%
|
2.98%
|
| Total Supply | 1.72%
|
-0.15%
|
| Source: BENTEK Energy LLC | ||
| U.S. Consumption - Gas Week: (5/8/13 - 5/15/13) | ||
|---|---|---|
Percent change for week compared with: |
||
last year |
last week |
|
| U.S. Consumption | -4.53%
|
0.11%
|
| Power | -19.66%
|
9.68%
|
| Industrial | 0.81%
|
-1.45%
|
| Residential/Commercial | 13.24%
|
-7.42%
|
| Total Demand | -3.85%
|
0.11%
|
| Source: BENTEK Energy LLC | ||
| Rigs | |||
|---|---|---|---|
Fri, May 10, 2013 |
Change from |
||
last week |
last year |
||
| Oil Rigs | 1,412 |
0.64% |
2.92% |
| Natural Gas Rigs | 350 |
-1.13% |
-41.47% |
| Miscellaneous | 7 |
0.00% |
75.00% |
| Rig Numbers by Type | |||
|---|---|---|---|
Fri, May 10, 2013 |
Change from |
||
last week |
last year |
||
| Vertical | 472 |
-0.63% |
-15.56% |
| Horizontal | 1,099 |
0.64% |
-7.41% |
| Directional | 198 |
0.51% |
-13.16% |
| Source: Baker Hughes Inc. | |||
| Working Gas in Underground Storage | ||||
|---|---|---|---|---|
Stocks billion cubic feet (bcf) |
||||
| Region | 5/10/13
|
5/3/13
|
change |
|
| East | 811 |
756 |
55
|
|
| West | 357 |
344 |
13
|
|
| Producing | 796 |
765 |
31
|
|
| Total | 1,964 |
1,865 |
99
|
|
| Source: U.S. Energy Information Administration | ||||
| Working Gas in Underground Storage | |||||
|---|---|---|---|---|---|
Historical Comparisons |
|||||
Year ago (5/10/12) |
5-year average (2008-2012) |
||||
| Region | Stocks (Bcf) |
% change |
Stocks (Bcf) |
% change |
|
| East | 1,229 |
-34.0 |
916 |
-11.5 |
|
| West | 385 |
-7.3 |
306 |
16.7 |
|
| Producing | 1,044 |
-23.8 |
825 |
-3.5 |
|
| Total | 2,658 |
-26.1 |
2,047 |
-4.1 |
|
| Source: U.S. Energy Information Administration | |||||
| Temperature -- Heating & Cooling Degree Days (week ending May 09) | ||||||||
|---|---|---|---|---|---|---|---|---|
HDD deviation from: |
CDD deviation from: |
|||||||
| Region | HDD Current |
normal |
last year |
CDD Current |
normal |
last year |
||
| New England | 71
|
-12
|
-13
|
0
|
0
|
0
|
||
| Middle Atlantic | 51
|
-17
|
8
|
0
|
-1
|
-1
|
||
| E N Central | 39
|
-34
|
17
|
1
|
-4
|
-16
|
||
| W N Central | 95
|
32
|
68
|
0
|
-7
|
-30
|
||
| South Atlantic | 44
|
16
|
42
|
19
|
-9
|
-41
|
||
| E S Central | 45
|
19
|
45
|
11
|
-8
|
-51
|
||
| W S Central | 40
|
32
|
38
|
16
|
-26
|
-70
|
||
| Mountain | 75
|
-2
|
17
|
12
|
-2
|
-5
|
||
| Pacific | 28
|
-18
|
-10
|
7
|
1
|
5
|
||
| United States | 49
|
-6
|
20
|
8
|
-6
|
-23
|
||
|
Note: HDD = heating degree-day; CDD = cooling degree-day Source: National Oceanic and Atmospheric Administration | ||||||||
Average temperature (°F)
7-Day Mean ending May 09, 2013
Source: NOAA/National Weather Service
Deviation between average and normal (°F)
7-Day Mean ending May 09, 2013
Source: NOAA/National Weather Service