In the News:
In the News: U.S. pipeline gas exports to Mexico largely driven by increased flows from Texas
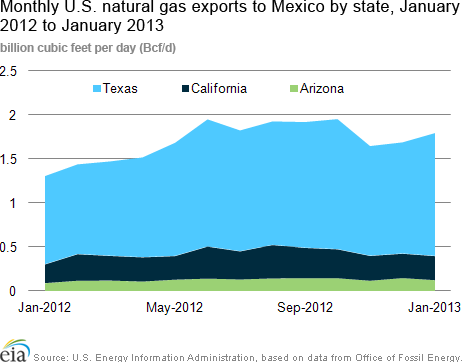
Average monthly pipeline exports of natural gas from the United States into Mexico from border points in Texas rose by 0.40 billion cubic feet per day (Bcf/d) between January 2012 and January 2013, according to U.S. Energy Information Administration (EIA) data. This accounted for over 80 percent of the 0.49 Bcf/d increase in average daily pipeline exports to Mexico that occurred over this period, with the remainder coming from California and Arizona.
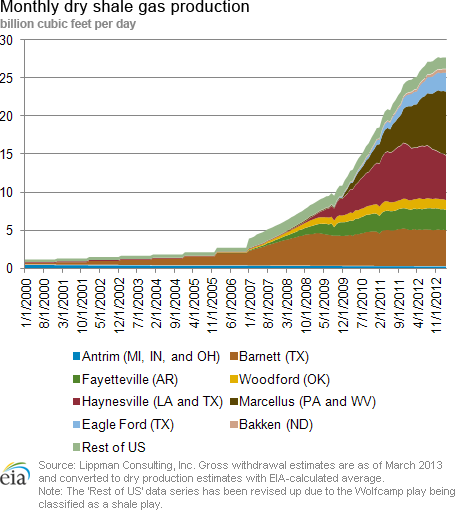
The three border crossings with the greatest increase in export volumes sent to Mexico were all located on the southwestern tip of the Texas-Mexico border, with two (Alamo, Texas and McAllen, Texas) in Hidalgo County, and the third (Roma, Texas) just west in the adjacent Starr County. All three are immediately to the south of the Eagle Ford shale play in the Western Gulf Basin. Exports to Mexico from these three crossings rose by a combined 0.42 Bcf/d from January 2012 to January 2013, 86 percent of the total increase in U.S. pipeline exports to Mexico. Exports from other Texas border crossings decreased by a combined 0.03 Bcf/d.
Mexico has relied increasingly on pipeline gas imported from the United States, as the country's levels of natural gas consumption have risen faster than production. Between 2007 and 2011, natural gas consumption in Mexico rose 4% per year on average, while average annual natural gas production climbed only 1.2%. Growing demand drove the increases in natural gas consumption in Mexico to a record-high level in 2011, according to Petróleos Mexicanos (PEMEX) – the state-run oil and natural gas producer in Mexico.
Additional data on the natural gas trade between the United States and Mexico as well as other countries is available on EIA's U.S. natural gas imports and exports page.
Overview:
(For the Week Ending Wednesday, May 2, 2013)
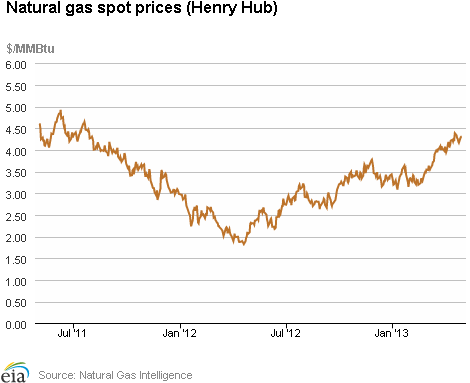
- Natural gas prices rose following declines earlier in the report week (Wednesday to Wednesday), except at Algonquin Citygate. The Henry Hub closed at $4.30 per million British thermal units (MMBtu) yesterday, up 5 cents and 1.2 percent for the week, after declining to $4.16 per MMBtu on Friday, April 26.
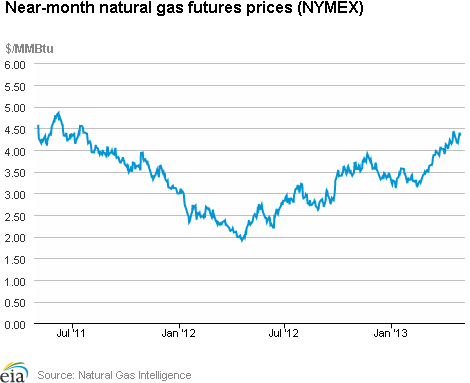
- At the NYMEX, the May 2013 contract also declined through Friday, April 26, to $4.152 per MMBtu. It then traded up 5.8 percent to $4.392 per MMBtu on Monday, April 29, its final day of trading. The near-month (June) NYMEX contract finished trading yesterday at $4.326 per MMBtu, 3 cents above the Henry Hub spot price.
- Working natural gas in storage increased last week to 1,777 Bcf as of Friday, April 26, according to EIA's Weekly Natural Gas Storage Report (WNGSR). An implied storage injection of 43 Bcf for the week put storage levels 795 Bcf below year-ago levels, and 118 Bcf below the 5-year average.
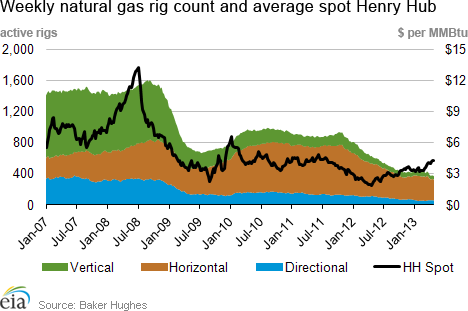
- The Baker Hughes Incorporated natural gas rotary rig count decreased by 13 units, from 379 to 366 as of Friday, April 26. The average oil rig count rose by 10 units to 1,381.
Prices:
Natural gas prices rose slightly following declines earlier in the report week, except at Algonquin Citygate. The Henry Hub price began the report week on Wednesday, April 24 at $4.25 per MMBtu, and declined to $4.16 per MMBtu on Friday, April 26 amid reports of warmer than normal temperatures for most of the country. It then rose back to $4.30 per MMBtu at the close of trading yesterday. Most other major trading hubs saw prices decline through last Friday and then increase through yesterday, with prices finishing the report week yesterday near or slightly above week-ago levels. One notable exception was the Algonquin Citygate hub serving Boston markets. There, the substantial price increases seen through the end of last report week continued through Thursday, April 25, before prices fell the next day by 71 cents per MMBtu, from $5.39 per MMBtu to $4.68 per MMBtu, likely in anticipation of warmer weekend temperatures. Prices at Algonquin closed slightly down from Friday's levels yesterday at $4.59 per MMBtu.
The Nymex futures price increased week-on-week, following earlier declines. The Nymex May contract price began the report week on Wednesday, April 24 at $4.166 per MMBtu, before trading down to $4.152 per MMBtu through Friday, April 26. On its final day of trading, the May contract rose by 24 cents per MMBtu or 5.8 percent to $4.392 per MMBtu on Monday, April 29. The Nymex June contract closed the week down 6.6 cents per MMBtu from the Monday high, at $4.326 per MMBtu. The 12-month strip (the average of June 2013 to May 2014 contracts) rose by 3.3 percent, ending the week at $4.459 per MMBtu.
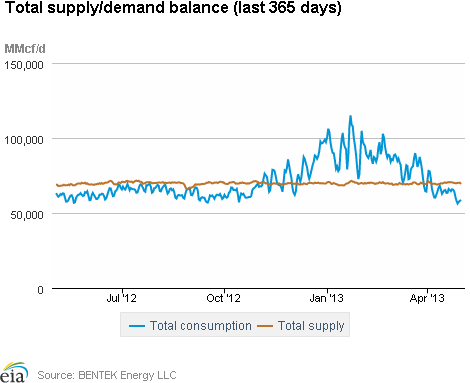
Total demand decreased significantly for the report week. According to BENTEK Energy Services LLC (Bentek) estimates, overall natural gas consumption in the United States decreased by 8.8 percent. As temperatures increased in most parts of the country, the residential/commercial sector consumed 24.3 percent less gas for the report period. This more than offset a 2.5 percent increase in the amount of natural gas consumed for electricity generation, driven by a 18.7 percent increase in electric sector natural gas use in Texas. Power burn also rose in the Midcontinent region by 22.9 percent and in the Southwest region by 2.7 percent, as well as in the Rockies and the Northeast, but declined by 5.0 percent in the Southeast and 11.9 percent in the Pacific Northwest, in addition to a decline in the Midwest. Industrial consumption decreased by 1.4 percent, while exports to Mexico increased by 11.2 percent.
Total supply for the report week was down slightly. Bentek estimates that supply was down slightly for the report period. U.S. gross and dry natural gas production both declined by 0.3 percent week-on-week, following last week's 0.8 percent increase. Dry gas production for the week is 2.0 percent above last year's level. Canadian imports were down 5.0 percent: imports in the West are up, while imports in the Midwest are down, and imports in the Northeast near zero. LNG imports, a very small contributor to U.S. supply, decreased by 8.1 percent.
Storage
Working natural gas in storage increased to 1,777 Bcf as of Friday, April 26, according to EIA's WNGSR. This represents an implied net injection of 43 Bcf from the previous week. Both the 5-year average and year-ago stock changes for the week were implied net injections of 67 Bcf and 31 Bcf, respectively. Inventories are currently 795 Bcf (30.9 percent) less than last year at this time and 118 Bcf (6.2 percent) below the 5-year average of 1,895 Bcf.
All three storage regions posted increases this week. Inventories in the East, West, and Producing regions increased by 18 Bcf (the 5-year average net injection is 38 Bcf), 5 Bcf (the 5-year average net injection is 10 Bcf), and 20 Bcf (the 5-year average net injection is 19 Bcf), respectively. In the Producing region, working natural gas inventories increased 11 Bcf (5.9 percent) in salt cavern facilities and increased 10 Bcf (1.9 percent) in nonsalt cavern facilities.
Temperatures during the storage report week were 4.6 degrees cooler than the 30-year normal temperature and 5.7 degrees cooler than the same period last year. Temperatures in the Lower 48 states averaged 50.7 degrees, compared to 56.4 degrees last year and the 30-year normal of 55.3 degrees. During the week, all but one of the Census divisions were cooler than the 30-year normal. The West North Central Census division in the Midwest and the West South Central Census division in the South were particularly cool, averaging 10.9 and 9.6 degrees, cooler, respectively, than the 30-year normal. In the West, the Pacific Census division was relatively warm, averaging 2.4 degrees warmer than the 30-year normal. Heating degree-days nationwide were 35.1 percent above normal and 52.9 percent above last year.
See also:
| Spot Prices ($/MMBtu) | Thu, 25-Apr |
Fri, 26-Apr |
Mon, 29-Apr |
Tue, 30-Apr |
Wed, 1-May |
|---|---|---|---|---|---|
| Henry Hub | 4.19 |
4.16 |
4.28 |
4.30 |
4.30 |
| New York | 4.35 |
4.24 |
4.42 |
4.48 |
4.49 |
| Chicago | 4.25 |
4.15 |
4.29 |
4.36 |
4.43 |
| Cal. Comp. Avg,* | 4.13 |
4.06 |
4.22 |
4.28 |
4.33 |
| Futures ($/MMBtu) | |||||
| May Contract | 4.167 |
4.152 |
Expired |
Expired |
Expired |
| June Contract | 4.200 |
4.223 |
4.392 |
4.343 |
4.326 |
| July Contract | 4.242 |
4.268 |
4.441 |
4.394 |
4.379 |
| *Avg. of NGI's reported prices for: Malin, PG&E citygate, and Southern California Border Avg. | |||||
| Source: NGI's Daily Gas Price Index | |||||
| U.S. Natural Gas Supply - Gas Week: (4/24/13 - 5/1/13) | ||
|---|---|---|
Percent change for week compared with: |
||
last year |
last week |
|
| Gross Production | 2.05%
|
-0.26%
|
| Dry Production | 2.03%
|
-0.25%
|
| Canadian Imports | -4.34%
|
-5.00%
|
| West (Net) | 14.16%
|
2.48%
|
| MidWest (Net) | 1.18%
|
-7.68%
|
| Northeast (Net) | -99.43%
|
-97.60%
|
| LNG Imports | -54.30%
|
-8.13%
|
| Total Supply | 1.23%
|
-0.62%
|
| Source: BENTEK Energy LLC | ||
| U.S. Consumption - Gas Week: (4/24/13 - 5/1/13) | ||
|---|---|---|
Percent change for week compared with: |
||
last year |
last week |
|
| U.S. Consumption | -11.27%
|
-9.30%
|
| Power | -24.83%
|
2.48%
|
| Industrial | 0.13%
|
-1.37%
|
| Residential/Commercial | -5.16%
|
-24.34%
|
| Total Demand | -10.71%
|
-8.84%
|
| Source: BENTEK Energy LLC | ||
| Rigs | |||
|---|---|---|---|
Fri, April 26, 2013 |
Change from |
||
last week |
last year |
||
| Oil Rigs | 1,381 |
0.73% |
3.99% |
| Natural Gas Rigs | 366 |
-3.43% |
-40.29% |
| Miscellaneous | 7 |
-12.50% |
75.00% |
| Rig Numbers by Type | |||
|---|---|---|---|
Fri, April 26, 2013 |
Change from |
||
last week |
last year |
||
| Vertical | 471 |
2.17% |
-16.34% |
| Horizontal | 1,084 |
-1.19% |
-4.83% |
| Directional | 199 |
-0.50% |
-18.11% |
| Source: Baker Hughes Inc. | |||
| Working Gas in Underground Storage | ||||
|---|---|---|---|---|
Stocks billion cubic feet (bcf) |
||||
| Region | 4/26/13
|
4/19/13
|
change |
|
| East | 704 |
686 |
18
|
|
| West | 339 |
334 |
5
|
|
| Producing | 734 |
714 |
20
|
|
| Total | 1,777 |
1,734 |
43
|
|
| Source: U.S. Energy Information Administration | ||||
| Working Gas in Underground Storage | |||||
|---|---|---|---|---|---|
Historical Comparisons |
|||||
Year ago (4/26/12) |
5-year average (2008-2012) |
||||
| Region | Stocks (Bcf) |
% change |
Stocks (Bcf) |
% change |
|
| East | 1,162 |
-39.4 |
824 |
-14.6 |
|
| West | 370 |
-8.4 |
285 |
18.9 |
|
| Producing | 1,040 |
-29.4 |
786 |
-6.6 |
|
| Total | 2,572 |
-30.9 |
1,895 |
-6.2 |
|
| Source: U.S. Energy Information Administration | |||||
| Temperature -- Heating & Cooling Degree Days (week ending Apr 25) | ||||||||
|---|---|---|---|---|---|---|---|---|
HDD deviation from: |
CDD deviation from: |
|||||||
| Region | HDD Current |
normal |
last year |
CDD Current |
normal |
last year |
||
| New England | 128
|
11
|
55
|
0
|
0
|
0
|
||
| Middle Atlantic | 117
|
17
|
26
|
0
|
0
|
0
|
||
| E N Central | 143
|
40
|
34
|
0
|
0
|
0
|
||
| W N Central | 168
|
75
|
73
|
0
|
-1
|
0
|
||
| South Atlantic | 77
|
31
|
20
|
17
|
-2
|
1
|
||
| E S Central | 77
|
35
|
17
|
0
|
-6
|
-1
|
||
| W S Central | 64
|
48
|
40
|
7
|
-19
|
-14
|
||
| Mountain | 133
|
33
|
84
|
5
|
-5
|
-21
|
||
| Pacific | 38
|
-21
|
17
|
0
|
-4
|
-9
|
||
| United States | 104
|
27
|
36
|
4
|
-5
|
-4
|
||
|
Note: HDD = heating degree-day; CDD = cooling degree-day Source: National Oceanic and Atmospheric Administration | ||||||||
Average temperature (°F)
7-Day Mean ending Apr 25, 2013
Source: NOAA/National Weather Service
Deviation between average and normal (°F)
7-Day Mean ending Apr 25, 2013
Source: NOAA/National Weather Service