In the News:
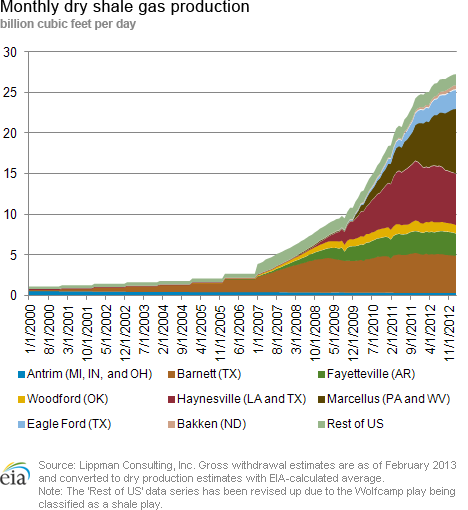
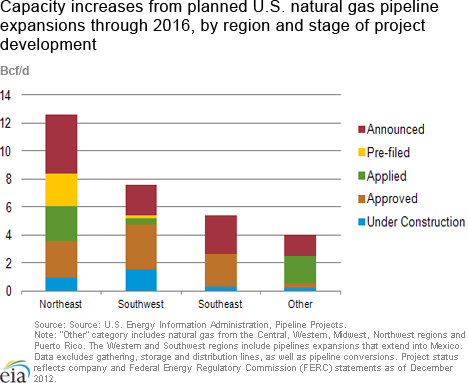
In the News: Planned natural gas pipeline expansions would add nearly 30 Bcf/d of new capacity through 2016
According to U.S. Energy Information Administration's (EIA) pipeline projects data, nearly 30 billion cubic feet per day (Bcf/d) of natural gas pipeline capacity in the United States is in some stage of proposed or planned development with scheduled completion dates through 2016. These data are based on the latest information available from company and Federal Energy Regulatory Commission (FERC) statements as of December 2012. It includes both new pipelines, and expansions and lateral extensions to existing pipelines. It is uncertain whether all currently planned expansion projects will be completed, although they are more likely to be constructed the further along they are in the approval process.
About 39 percent or 11.5 Bcf/d of the planned capacity projects have received approval from FERC. Currently, only 10 percent of the planned additions are actively under construction, with more than half of those located in the Southwest. Combining all stages of project development, above 40 percent of all planned pipeline projects are located in the Northeast, which accounted for over half of all completed natural gas pipeline projects in 2012. Despite material gains in pipeline capacity additions and shale-driven natural gas production in the United States since 2005, the greater New York metropolitan area and especially New England markets still experience frequent constraints.
Overview:
(For the Week Ending Wednesday, March 27, 2013)
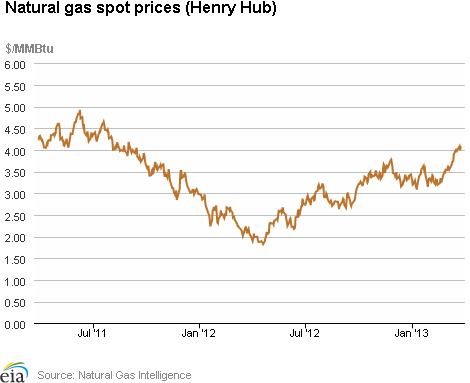
- Both spot and futures prices reached 18-month record highs during this report week (Wednesday, March 20 – Wednesday, March 27). The Henry Hub spot price rose from $3.96 per million British thermal units (MMBtu) last Wednesday to $4.08 per MMBtu yesterday, its highest level since September 2011. Price changes were mixed, and mostly small, with the exception of large declines in the Northeast United States.
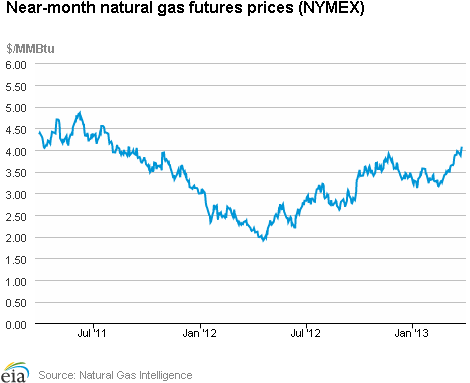
- At the NYMEX, futures contracts made gains similar to the Henry Hub price. The April 2013 NYMEX natural gas contract expired Tuesday, March 26, just under $4 per MMBtu. The May 2013 contract moved into the near-month slot and ended trading yesterday at $4.068 per MMBtu.
- Working natural gas in storage declined to 1,781 Bcf as of Friday, March 22, according to EIA's Weekly Natural Gas Storage Report (WNGSR). An implied storage withdrawal of 95 Bcf for the week moved storage levels 642 Bcf below year-ago levels, and 61 Bcf above the 5-year average.
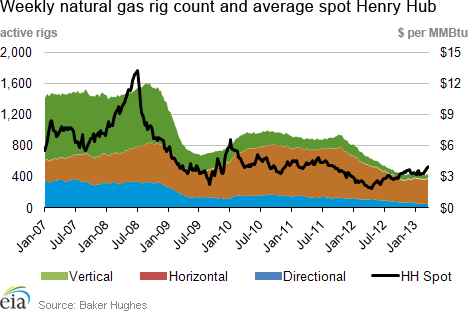
- Natural gas rotary rigs totaled 418 as of Friday, March 22, according to data released by Baker Hughes Incorporated. This represents a decline of 13 rigs from the previous week. Oil rigs fell by 17 to 1,324.
Prices:
Natural gas prices increased in the Gulf Coast, and the western states. The Henry Hub spot price rose from $3.96 per MMBtu last Wednesday to $4.08 per MMBtu yesterday, continuing its general increasing trend of the past 6 weeks. On Thursday, March 21, for the first time since September 2011, Henry Hub prices rose above the $4 per MMBtu threshold. Around most of the country, spot prices posted modest gains.
Prices in the Northeast declined as temperatures moderated from the unseasonably cold weather seen in the beginning of the report week. The largest declines were in New England; the spot price at the Algonquin Citygate, which serves Boston consumers, fell from $11.57 per MMBtu last Wednesday to $4.70 per MMBtu yesterday. Declines were more moderate in other areas of the Northeast; at Transcontinental Pipeline's Zone 6 trading point for delivery into New York City, prices declined from $5.43 per MMBtu last Wednesday to $4.24 per MMBtu yesterday. Because of pipeline and infrastructure constraints, prices in the Northeast and particularly New England tend to spike into the double digits during cold snaps. Outside of the Northeast, the other declines this week were modest and mainly concentrated in the Midcontinent and Midwest.
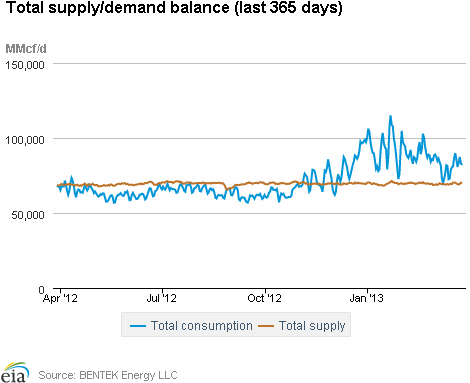
Natural gas supply remained mostly flat over the week, with increases in Canadian imports offsetting declines in production. Dry production declined by 0.3 percent from the previous week, but remains 0.6 percent greater than its year-ago levels, according to BENTEK Energy Services LLC (Bentek) data. Canadian imports increased 16.7 percent during the report week. Domestic consumption increased 7 percent over the report week, with increases in all of the consuming sectors. Use of natural gas for power generation increased 12.1 percent, with large increases in the Southeast. Residential and commercial consumption averaged 8.2 percent greater than last week. Residential and commercial consumption this week, which was unseasonably cold, was 101 percent greater than last year at this time, which was unseasonably warm.
At the New York Mercantile Exchange, the April 2013 futures contract expired at $3.976 per MMBtu, having gained 54.2 cents during its tenure as the near-month contract. During its first day in the near-month slot, the May 2013 contract broke the $4 per MMBtu threshold. Yesterday was the first time since September 2011 that a near-month contract has settled at greater than $4 per MMBtu. The 12-month strip (the average of the 12 contracts between May 2013 and April 2014) gained from $4.139 per MMBtu to $4.231 per MMBtu.
Storage
Working natural gas in storage decreased to 1,781 Bcf as of Friday, March 22, according to EIA's WNGSR. This represents an implied net withdrawal of 95 Bcf from the previous week, and is the largest net withdrawal for this time of year since 2006. Both the 5-year average and year-ago stock changes for the week were implied net injections of 6 Bcf and 45 Bcf, respectively. Inventories are currently 642 Bcf (26.5 percent) less than last year at this time and 61 Bcf (3.5 percent) greater than the 5-year average of 1,720 Bcf.
All three storage regions posted declines this week. Inventories in the East, West, and Producing regions decreased by 73 Bcf (the 5-year average net withdrawal is 11 Bcf), 5 Bcf (the 5-year average net withdrawal is 1 Bcf), and 17 Bcf (compared with the 5-year average net injection of 16 Bcf), respectively. In the Producing region, working natural gas inventories decreased 2 Bcf (1.1 percent) in salt cavern facilities and decreased 16 Bcf (2.8 percent) in nonsalt cavern facilities.
Temperatures during the storage report week were 3.1 degrees cooler than the 30-year normal temperature and 16.9 degrees cooler than the same period last year. Temperatures in the Lower 48 states averaged 42.1 degrees, compared to 59.0 degrees last year and the 30-year normal of 45.3 degrees. While overall temperatures were a few degrees cooler than normal, temperatures varied somewhat across Census divisions. In the Midwest, the East North Central and West North Central Census divisions were particularly cool, averaging 8.6 and 8.4 degrees cooler, respectively, than the 30-year normal. In the West, the Mountain and Pacific Census divisions were relatively warm, averaging 5.4 and 3.7 degrees warmer, respectively, than the 30-year normal. Heating degree-days nationwide were 14.7 percent above normal and 198.2 percent above last year.
See also:
| Spot Prices ($/MMBtu) | Thu, 21-Mar |
Fri, 22-Mar |
Mon, 25-Mar |
Tue, 26-Mar |
Wed, 27-Mar |
|---|---|---|---|---|---|
| Henry Hub | 4.01 |
4.01 |
4.08 |
3.99 |
4.08 |
| New York | 4.84 |
4.52 |
4.40 |
4.29 |
4.24 |
| Chicago | 4.39 |
4.31 |
4.33 |
4.19 |
4.21 |
| Cal. Comp. Avg,* | 4.15 |
4.14 |
4.16 |
4.05 |
4.10 |
| Futures ($/MMBtu) | |||||
| April Contract | 3.935 |
3.927 |
3.865 |
3.976 |
Expired |
| May Contract | 3.961 |
3.952 |
3.888 |
3.991 |
4.068 |
| June Contract | 3.998 |
3.993 |
3.930 |
4.031 |
4.108 |
| *Avg. of NGI's reported prices for: Malin, PG&E citygate, and Southern California Border Avg. | |||||
| Source: NGI's Daily Gas Price Index | |||||
| U.S. Natural Gas Supply - Gas Week: (3/20/13 - 3/27/13) | ||
|---|---|---|
Percent change for week compared with: |
||
last year |
last week |
|
| Gross Production | 0.62%
|
-0.27%
|
| Dry Production | 0.61%
|
-0.27%
|
| Canadian Imports | 13.28%
|
4.05%
|
| West (Net) | 14.61%
|
16.69%
|
| MidWest (Net) | -5.41%
|
-2.87%
|
| Northeast (Net) | 60.20%
|
-12.61%
|
| LNG Imports | -56.21%
|
40.94%
|
| Total Supply | 1.04%
|
0.13%
|
| Source: BENTEK Energy LLC | ||
| U.S. Consumption - Gas Week: (3/20/13 - 3/27/13) | ||
|---|---|---|
Percent change for week compared with: |
||
last year |
last week |
|
| U.S. Consumption | 31.11%
|
7.01%
|
| Power | -12.15%
|
12.08%
|
| Industrial | 9.71%
|
0.35%
|
| Residential/Commercial | 100.88%
|
8.18%
|
| Total Demand | 31.33%
|
6.99%
|
| Source: BENTEK Energy LLC | ||
| Rigs | |||
|---|---|---|---|
Fri, March 22, 2013 |
Change from |
||
last week |
last year |
||
| Oil Rigs | 1,324 |
-1.27% |
0.84% |
| Natural Gas Rigs | 418 |
-3.02% |
-35.89% |
| Miscellaneous | 4 |
0.00% |
33.33% |
| Rig Numbers by Type | |||
|---|---|---|---|
Fri, March 22, 2013 |
Change from |
||
last week |
last year |
||
| Vertical | 432 |
-0.92% |
-23.27% |
| Horizontal | 1,100 |
-2.74% |
-6.30% |
| Directional | 214 |
2.39% |
-7.36% |
| Source: Baker Hughes Inc. | |||
| Working Gas in Underground Storage | ||||
|---|---|---|---|---|
Stocks billion cubic feet (bcf) |
||||
| Region | 3/22/13
|
3/15/13
|
change |
|
| East | 710 |
783 |
-73
|
|
| West | 334 |
339 |
-5
|
|
| Producing | 737 |
754 |
-17
|
|
| Total | 1,781 |
1,876 |
-95
|
|
| Source: U.S. Energy Information Administration | ||||
| Working Gas in Underground Storage | |||||
|---|---|---|---|---|---|
Historical Comparisons |
|||||
Year ago (3/22/12) |
5-year average (2008-2012) |
||||
| Region | Stocks (Bcf) |
% change |
Stocks (Bcf) |
% change |
|
| East | 1,070 |
-33.6 |
751 |
-5.5 |
|
| West | 344 |
-2.9 |
261 |
28.0 |
|
| Producing | 1,009 |
-27.0 |
707 |
4.2 |
|
| Total | 2,423 |
-26.5 |
1,720 |
3.5 |
|
| Source: U.S. Energy Information Administration | |||||
| Temperature -- Heating & Cooling Degree Days (week ending Mar 21) | ||||||||
|---|---|---|---|---|---|---|---|---|
HDD deviation from: |
CDD deviation from: |
|||||||
| Region | HDD Current |
normal |
last year |
CDD Current |
normal |
last year |
||
| New England | 245
|
49
|
137
|
0
|
0
|
0
|
||
| Middle Atlantic | 225
|
44
|
155
|
0
|
0
|
0
|
||
| E N Central | 250
|
60
|
225
|
0
|
0
|
-9
|
||
| W N Central | 247
|
58
|
214
|
0
|
-1
|
-10
|
||
| South Atlantic | 121
|
15
|
103
|
7
|
-5
|
-16
|
||
| E S Central | 108
|
8
|
99
|
0
|
-5
|
-23
|
||
| W S Central | 44
|
-15
|
37
|
17
|
5
|
-25
|
||
| Mountain | 121
|
-33
|
-6
|
7
|
5
|
6
|
||
| Pacific | 61
|
-27
|
-51
|
0
|
-1
|
0
|
||
| United States | 164
|
21
|
109
|
4
|
-1
|
-9
|
||
|
Note: HDD = heating degree-day; CDD = cooling degree-day Source: National Oceanic and Atmospheric Administration | ||||||||
Average temperature (°F)
7-Day Mean ending Mar 21, 2013
Source: NOAA/National Weather Service
Deviation between average and normal (°F)
7-Day Mean ending Mar 21, 2013
Source: NOAA/National Weather Service