In the News:
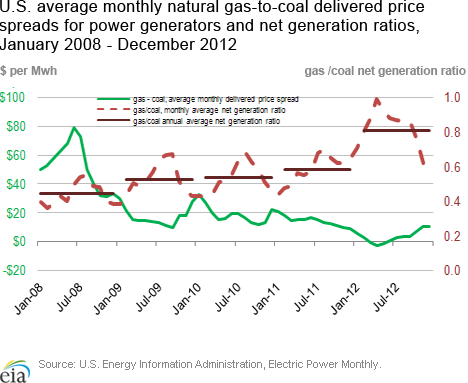
In the News: Average price spread of natural gas delivered to the power sector over coal declined by over three-quarters in 2012, while ratio of net natural gas power generation to coal rose by 39 percent.
The average price of natural gas delivered in the United States to electric power generators decreased to $28.16 per megawatt hour (MWh) in 2012, 28 percent below the average for 2011, according to data from the U.S. Energy Information Administration's (EIA) Electric Power Monthly. This reflects a spread of $3.22 per MWh over the average annual price of coal delivered to the power sector in 2012, less than one-quarter of the $14.20 per MWh average spread in 2011, and just over one-fifth of the $16.49 per MWh average spread from 2009 to 2011.
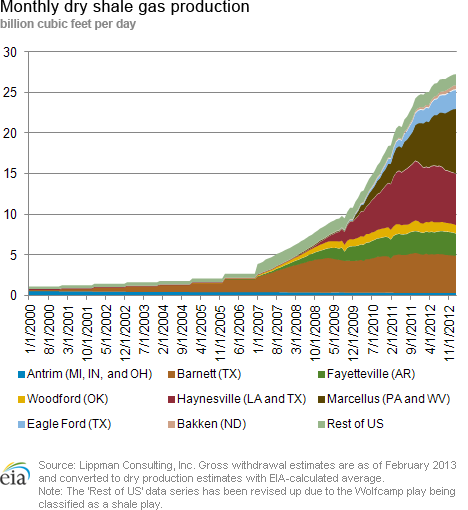
During 2012 in the United States, power generation from natural gas rose by 21 percent above 2011 levels to 1,231 million MWh, while generation from coal decreased by 12 percent to 1,517 million MWh. The average ratio of power generated from natural gas to power generated from coal reached 0.81 in 2012, 39 percent above the 0.58 average ratio in 2011, and 82 percent above the 0.44 ratio in 2008, when average Henry Hub natural gas prices were more than double the annual averages seen since. For 2013 and 2014, EIA's Short-Term Energy Outlook forecasts the gas/coal net generation ratio to come down from its 2012 level, but to stay above the level seen in 2010 as the natural gas to coal price spread increases from 2012 levels while staying below the average 2010 level.
Overview:
(For the Week Ending Wednesday, March 20, 2013)
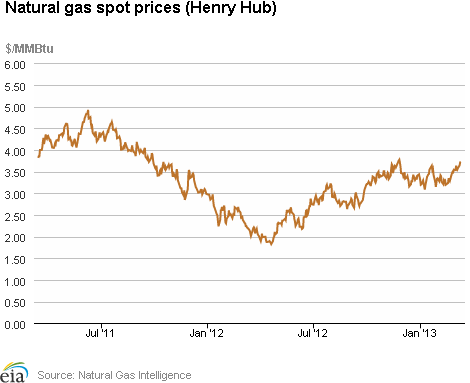
- Natural gas prices were up across the report week (Wednesday to Wednesday). Prices increased by around 25 to 30 cents per million British thermal units (MMBtu) at most price points, with the exception of Northeastern points, which rose more substantially. The Henry Hub closed at $3.96 MMBtu yesterday, up 24 cents for the week.
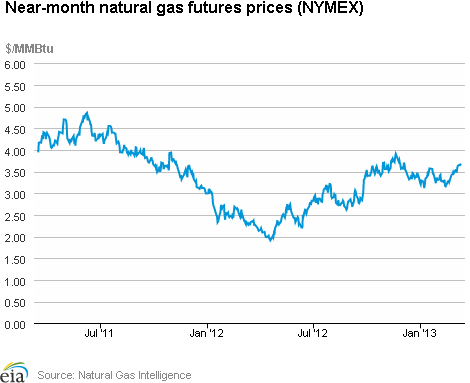
- The April 2013 New York Mercantile Exchange (Nymex) contract rose apace with the Henry Hub spot price, from $3.680 per MMBtu last Wednesday to close at $3.960 per MMBtu yesterday.
- Working natural gas in storage fell last week to 1,876 billion cubic feet (Bcf) as of Friday, March 15, according to EIA's Weekly Natural Gas Storage Report (WNGSR). An implied storage withdrawal of 62 Bcf for the week put storage levels 502 Bcf below year-ago levels, and 162 Bcf above the 5-year average.
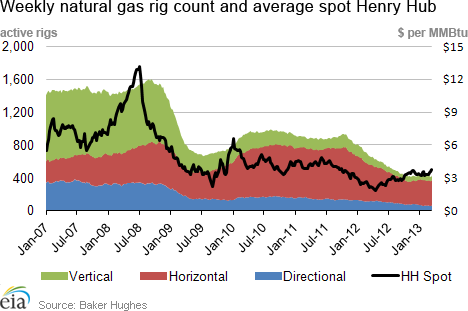
- The Baker Hughes Incorporated natural gas rotary rig count increased by 24 units, from 407 to 431 as of Friday, March 15, after falling through most of 2012 and early 2013. The average oil rig count stayed flat at 1,341.
Prices:
Natural gas prices are up at most market locations, increasing most significantly at Algonquin Citygate. The Henry Hub price increased from $3.72 per MMBtu last Wednesday to $3.96 yesterday, an increase of 24 cents per MMBtu, or 6 percent. Most trading points increased between 25 and 30 cents per MMBtu week-on-week, with the notable exception of the Northeast. Transco Zone 6 NY, serving New York City, increased by 30 percent from Wednesday to Wednesday, moving from $4.17 per MMBtu to $5.43 per MMBtu. Algonquin Citygate, serving Boston markets, was substantially above Transco Zone 6 prices, rising from $8.69 per MMBtu last Wednesday to $11.57 per MMBtu yesterday, an increase of $2.88 per MMBtu. Weather in the Midwest and Northeast was cold relative to last week and relative to the historical norm.
The Nymex futures price rose week-on-week. The near-month Nymex price increased by 28 cents per MMBtu over the report period, from $3.680 per MMBtu last Wednesday to $3.960 per MMBtu yesterday. The near-month Nymex price closed below $4.00 per MMBtu on every trading day since September 2011. The 12-Month Strip (the average of April 2013 to March 2014 contracts) similarly rose over the report period, increasing by 22 cents per MMBtu and ending the week at $4.139 per MMBtu.
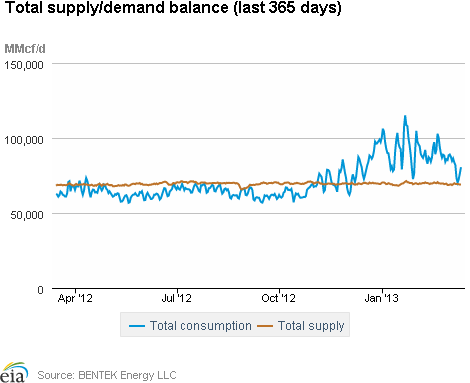
Total demand for the report week was up. According to BENTEK Energy Services LLC (Bentek) estimates, overall natural gas consumption for the nation increased by 2.1 percent. The residential/commercial sector, the biggest gas-consuming sector during the winter, consumed 5.1 percent more gas for the report period. The Midwest and Northeast experienced colder weather than last week, pushing residential/commercial demand higher. Residential/commercial volumes are 101 percent higher than this week last year due to last year's short heating season. Industrial consumption of natural gas increased by 1.1 percent for the report week, while natural gas consumption for power generation was down on average, falling by 2.2 percent. Likely because of the cold, Northeast and Midwest states consumed 4.8 percent and 16.9 percent more gas for electric generation, respectively. In contrast to the North, much of the South, particularly the Southwest, experienced warmer weather for the report week. Gas consumption for electric generation was down in the Southeast by 3.6 percent, Midcontinent by 20.2 percent, Southwest by 8.6 percent, and Pacific Northwest by 23.4 percent. The net effect was an overall decrease in gas burned for electric generation.
Total supply for the report week was flat. Bentek estimates that supply was unchanged for the report period. U.S. gross and dry natural gas production were up slightly, rising by 0.1 percent over last week. Dry production for the week is 0.7 percent above last year's levels. A net decrease in Canadian imports of 1.1 percent offset the increase in production. Driving the decrease in Canadian imports was a 5.7 percent drop in imports to the West likely due to warm weather in the Southwest for the report period. LNG imports decreased by 14.1 percent, although they are currently a negligible contributor to U.S. supply.
Storage
Working natural gas in storage decreased to 1,876 Bcf as of Friday, March 15, according to EIA's WNGSR. This represents an implied net withdrawal of 62 Bcf from the previous week. This week's net withdrawal was 36 Bcf larger than the 5-year average net withdrawal of 26 Bcf, and 62 Bcf larger than last year's average net withdrawal of zero. Inventories are currently 502 Bcf (21.1 percent) less than last year at this time and 162 Bcf (9.54 percent) greater than the 5-year average of 1,714 Bcf.
Two of the three storage regions posted declines this week. Inventories in the East and Producing regions decreased by 47 Bcf (the 5-year average net withdrawal is 30 Bcf) and 15 Bcf (compared with the 5-year average net injection of 7 Bcf), respectively. Inventories in the West region remain unchanged (compared with the 5-year average net withdrawal of 2 Bcf). In the Producing region, working natural gas inventories increased 5 Bcf (2.9 percent) in salt cavern facilities and decreased 20 Bcf (3.4 percent) in nonsalt cavern facilities.
Temperatures during the storage report week were 0.6 degrees warmer than the 30-year normal temperature and 6.1 degrees cooler than the same period last year. Temperatures in the Lower 48 states averaged 43.9 degrees, compared to 50.0 degrees last year and the 30-year normal of 43.3 degrees. While overall temperatures were about a degree warmer than normal, temperatures varied somewhat across Census divisions. In the Northeast, the New England and Mid Atlantic Census divisions were relatively warm, both averaging 3.6 degrees warmer than the 30-year normal. The West North Central Census division in the Midwest and the East South Central Census division in the South were relatively cool, both averaging 2.4 degrees cooler than the 30-year normal. Heating degree-days nationwide were 3.9 percent below normal and 36.4 percent above last year.
See also:
| Spot Prices ($/MMBtu) | Thu, 14-Mar |
Fri, 15-Mar |
Mon, 18-Mar |
Tue, 19-Mar |
Wed, 20-Mar |
|---|---|---|---|---|---|
| Henry Hub | 3.74 |
3.89 |
3.98 |
3.96 |
3.96 |
| New York | 4.00 |
4.09 |
4.29 |
4.43 |
5.43 |
| Chicago | 3.88 |
4.07 |
4.38 |
4.36 |
4.34 |
| Cal. Comp. Avg,* | 3.79 |
3.93 |
4.04 |
4.03 |
4.06 |
| Futures ($/MMBtu) | |||||
| April Contract | 3.812 |
3.872 |
3.882 |
3.969 |
3.960 |
| May Contract | 3.848 |
3.909 |
3.914 |
3.995 |
3.985 |
| *Avg. of NGI's reported prices for: Malin, PG&E citygate, and Southern California Border Avg. | |||||
| Source: NGI's Daily Gas Price Index | |||||
| U.S. Natural Gas Supply - Gas Week: (3/13/13 - 3/20/13) | ||
|---|---|---|
Percent change for week compared with: |
||
last year |
last week |
|
| Gross Production | 0.70%
|
0.13%
|
| Dry Production | 0.69%
|
0.13%
|
| Canadian Imports | 13.49%
|
-1.09%
|
| West (Net) | -8.21%
|
-5.70%
|
| MidWest (Net) | 15.03%
|
2.83%
|
| Northeast (Net) | 121.11%
|
3.83%
|
| LNG Imports | -63.72%
|
-14.08%
|
| Total Supply | 1.11%
|
0.00%
|
| Source: BENTEK Energy LLC | ||
| U.S. Consumption - Gas Week: (3/13/13 - 3/20/13) | ||
|---|---|---|
Percent change for week compared with: |
||
last year |
last week |
|
| U.S. Consumption | 26.19%
|
2.13%
|
| Power | -21.87%
|
-2.22%
|
| Industrial | 10.89%
|
1.06%
|
| Residential/Commercial | 101.02%
|
5.07%
|
| Total Demand | 26.40%
|
2.45%
|
| Source: BENTEK Energy LLC | ||
| Rigs | |||
|---|---|---|---|
Fri, March 15, 2013 |
Change from |
||
last week |
last year |
||
| Oil Rigs | 1,341 |
0.00% |
1.82% |
| Natural Gas Rigs | 431 |
5.90% |
-34.99% |
| Miscellaneous | 4 |
0.00% |
0.00% |
| Rig Numbers by Type | |||
|---|---|---|---|
Fri, March 15, 2013 |
Change from |
||
last week |
last year |
||
| Vertical | 436 |
2.11% |
-24.31% |
| Horizontal | 1,131 |
0.09% |
-4.15% |
| Directional | 209 |
7.18% |
-8.33% |
| Source: Baker Hughes Inc. | |||
| Working Gas in Underground Storage | ||||
|---|---|---|---|---|
Stocks billion cubic feet (bcf) |
||||
| Region | 3/15/13
|
3/8/13
|
change |
|
| East | 783 |
830 |
-47
|
|
| West | 339 |
339 |
0
|
|
| Producing | 754 |
769 |
-15
|
|
| Total | 1,876 |
1,938 |
-62
|
|
| Source: U.S. Energy Information Administration | ||||
| Working Gas in Underground Storage | |||||
|---|---|---|---|---|---|
Historical Comparisons |
|||||
Year ago (3/15/12) |
5-year average (2008-2012) |
||||
| Region | Stocks (Bcf) |
% change |
Stocks (Bcf) |
% change |
|
| East | 1,050 |
-25.4 |
762 |
2.8 |
|
| West | 346 |
-2.0 |
262 |
29.4 |
|
| Producing | 982 |
-23.2 |
691 |
9.1 |
|
| Total | 2,378 |
-21.1 |
1,714 |
9.5 |
|
| Source: U.S. Energy Information Administration | |||||
| Temperature -- Heating & Cooling Degree Days (week ending Mar 14) | ||||||||
|---|---|---|---|---|---|---|---|---|
HDD deviation from: |
CDD deviation from: |
|||||||
| Region | HDD Current |
normal |
last year |
CDD Current |
normal |
last year |
||
| New England | 186
|
-25
|
44
|
0
|
0
|
0
|
||
| Middle Atlantic | 173
|
-25
|
45
|
0
|
0
|
0
|
||
| E N Central | 207
|
-1
|
80
|
0
|
0
|
0
|
||
| W N Central | 224
|
16
|
88
|
0
|
-1
|
0
|
||
| South Atlantic | 122
|
3
|
42
|
5
|
-5
|
-9
|
||
| E S Central | 126
|
13
|
61
|
0
|
-4
|
-3
|
||
| W S Central | 72
|
2
|
21
|
5
|
-5
|
-11
|
||
| Mountain | 152
|
-12
|
4
|
2
|
1
|
2
|
||
| Pacific | 73
|
-19
|
-24
|
0
|
-1
|
0
|
||
| United States | 150
|
-6
|
40
|
2
|
-2
|
-3
|
||
|
Note: HDD = heating degree-day; CDD = cooling degree-day Source: National Oceanic and Atmospheric Administration | ||||||||
Average temperature (°F)
7-Day Mean ending Mar 14, 2013
Source: NOAA/National Weather Service
Deviation between average and normal (°F)
7-Day Mean ending Mar 14, 2013
Source: NOAA/National Weather Service