In the News:
EIA projects end-of-season inventories less than 2 trillion cubic feet (Tcf).
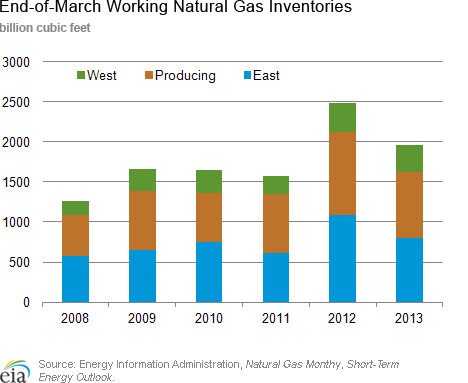
U.S. Energy Information Administration (EIA) projects working inventories of natural gas in storage will end the heating season at levels significantly lower than last year. This month's Short-Term Energy Outlook projects that at the end of March, inventories will total 1,959 billion cubic feet (Bcf), which is lower than last year's record high level but still greater than recent years. Last year at the end of March working inventories totaled 2,477 Bcf, which was the result of robust natural gas production combined with low demand from a warm winter. For much of this winter heating season, inventories have remained greater than the five-year ( 2008-2012) average and below the previous year's levels.
EIA expects that total net additions to inventories over the 2013 summer injection season (April 1 to October 31) will total 1,961 Bcf. In the past 5 years, the overall net additions to working gas in storage during the injection season have averaged 2,032 Bcf. Due to the high end of winter inventories last year, net injections during the 2012 summer season only totaled 1,453 Bcf.
Overview:
(For the Week Ending Wednesday, March 13, 2013)
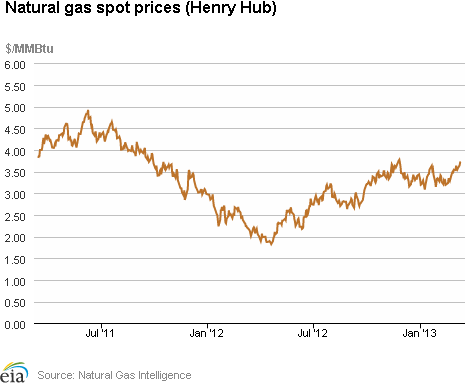
- Natural gas prices at major trading hubs increased moderately for the report week (Wednesday to Wednesday). Henry Hub prices increased from $3.57 per million British thermal units (MMBtu) last Wednesday to $3.72 per MMBtu yesterday, while natural gas prices at Algonquin Citygate, for delivery into Boston increased from $7.77 per MMBtu to $8.69 per MMBtu.
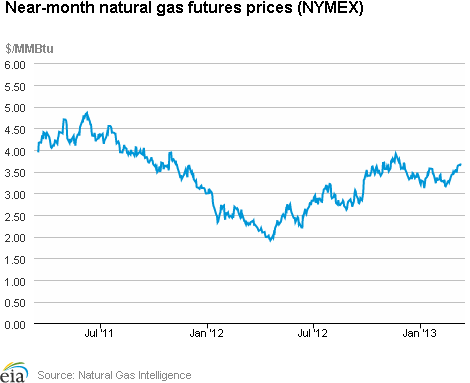
- The April 2013 New York Mercantile Exchange (Nymex) contract increased by 21 cents, from $3.470 per MMBtu last Wednesday to close at $3.680 per MMBtu yesterday.
- Working natural gas in storage declined to 1,938 Bcf as of Friday, March 8, according to EIA's Weekly Natural Gas Storage Report (WNGSR). An implied storage withdrawal of 145 Bcf for the week moved storage levels 440 Bcf below year-ago levels, and 198 Bcf above the 5-year average.
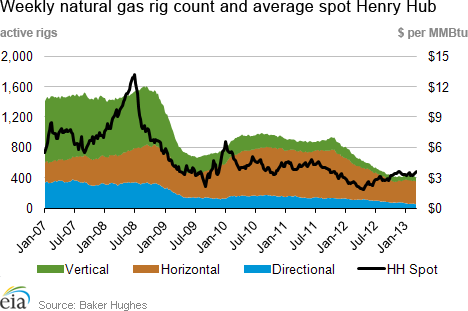
- The Baker Hughes Incorporated natural gas rotary rig count decreased by 13 to 407 active units on the week ending March 8, 2013. The oil-directed rig count increased by 8 to 1,341 units.
Prices:
Natural gas prices rose modestly at most locations during the report week (Wednesday, March 6, to Wednesday, March 13), particularly in New England. Lingering cold temperatures in the Midwest and Northeast likely contributed to the price increases. Temperatures in New England were warmer than normal most days of the previous week, alleviating pressure on the Algonquin Citygate price, which fell from $7.77 per MMBtu last Wednesday to $5.80 per MMBtu on Tuesday. However, on Wednesday, the Algonquin Citygate price increased by 50 percent or $2.89 per MMBtu, likely due to expectations of colder temperatures on Thursday, and ended the week higher than it started at $8.69 per MMBtu. The snow and cold continue to be widespread in the Midwest and Northeast, providing support for the current price environment.
The Nymex April futures price rose from $3.470 per MMBtu last Wednesday to $3.680 per MMBtu yesterday. During the week, the futures price spread over the Henry Hub daily spot price averaged between -10 and 6 cents per MMBtu. The 12-Month Strip (average of April 2013 to March 2014 contracts) gained 16 cents per MMBtu, starting at $3.761 per MMBtu last Wednesday and landing at $3.916 per MMBtu yesterday.
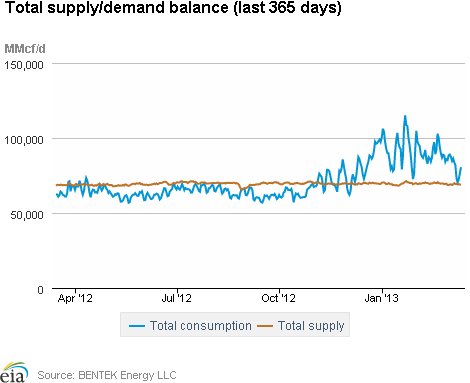
According to estimates from BENTEK Energy Services LLC (Bentek), average natural gas consumption for the nation fell this report week by 11.5 percent over last week's daily average. Natural gas consumption decreased in all sectors and most notably in the residential/commercial and power sectors, which fell by 15.7 and 12.7 percent, respectively, for the report week. This is the result of warmer weather in most parts of the country compared with the previous week.
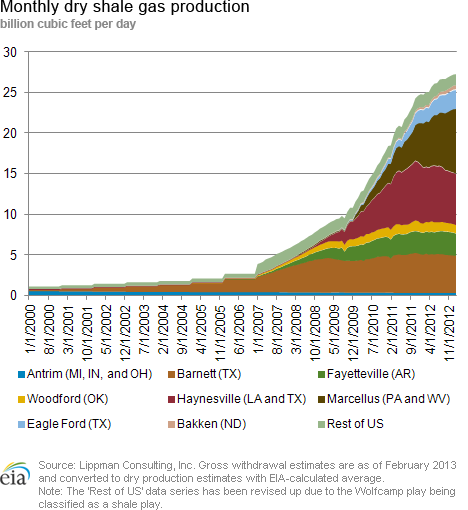
Bentek estimates that the average daily natural gas supply for this report week increased modestly by 0.5 percent over the previous week's daily average. Dry natural gas production and imports from Canada increased by 0.4 percent and 3.3 percent, respectively, from the previous week.
Storage
See also:
| Spot Prices ($/MMBtu) | Thu, 07-Mar |
Fri, 08-Mar |
Mon, 11-Mar |
Tue, 12-Mar |
Wed, 13-Mar |
|---|---|---|---|---|---|
| Henry Hub | 3.54 |
3.57 |
3.64 |
3.71 |
3.72 |
| New York | 3.94 |
3.75 |
3.87 |
4.00 |
4.17 |
| Chicago | 3.67 |
3.70 |
3.75 |
3.86 |
3.86 |
| Cal. Comp. Avg,* | 3.69 |
3.70 |
3.72 |
3.75 |
3.77 |
| Futures ($/MMBtu) | |||||
| April Contract | 3.582 |
3.629 |
3.649 |
3.645 |
3.680 |
| May Contract | 3.627 |
3.673 |
3.689 |
3.684 |
3.718 |
| *Avg. of NGI's reported prices for: Malin, PG&E citygate, and Southern California Border Avg. | |||||
| Source: NGI's Daily Gas Price Index | |||||
| U.S. Natural Gas Supply - Gas Week: (3/6/13 - 3/13/13) | ||
|---|---|---|
Percent change for week compared with: |
||
last year |
last week |
|
| Gross Production | 1.32%
|
0.42%
|
| Dry Production | 1.31%
|
0.41%
|
| Canadian Imports | 2.00%
|
3.27%
|
| West (Net) | -15.16%
|
4.35%
|
| MidWest (Net) | 30.41%
|
1.27%
|
| Northeast (Net) | 19.72%
|
3.88%
|
| LNG Imports | -51.32%
|
-37.61%
|
| Total Supply | 1.08%
|
0.46%
|
| Source: BENTEK Energy LLC | ||
| U.S. Consumption - Gas Week: (3/6/13 - 3/13/13) | ||
|---|---|---|
Percent change for week compared with: |
||
last year |
last week |
|
| U.S. Consumption | 11.25%
|
-11.55%
|
| Power | -15.91%
|
-12.67%
|
| Industrial | 5.47%
|
-2.02%
|
| Residential/Commercial | 38.44%
|
-15.72%
|
| Total Demand | 11.48%
|
-11.29%
|
| Source: BENTEK Energy LLC | ||
| Rigs | |||
|---|---|---|---|
Fri, March 08, 2013 |
Change from |
||
last week |
last year |
||
| Oil Rigs | 1,341 |
0.60% |
3.47% |
| Natural Gas Rigs | 407 |
-3.10% |
-39.25% |
| Miscellaneous | 4 |
0.00% |
-42.86% |
| Rig Numbers by Type | |||
|---|---|---|---|
Fri, March 08, 2013 |
Change from |
||
last week |
last year |
||
| Vertical | 427 |
-0.93% |
-28.48% |
| Horizontal | 1,130 |
-0.96% |
-2.92% |
| Directional | 195 |
5.41% |
-8.02% |
| Source: Baker Hughes Inc. | |||
| Working Gas in Underground Storage | ||||
|---|---|---|---|---|
Stocks billion cubic feet (bcf) |
||||
| Region | 3/8/13
|
3/1/13
|
change |
|
| East | 830 |
922 |
-92
|
|
| West | 339 |
344 |
-5
|
|
| Producing | 769 |
817 |
-48
|
|
| Total | 1,938 |
2,083 |
-145
|
|
| Source: U.S. Energy Information Administration | ||||
| Working Gas in Underground Storage | |||||
|---|---|---|---|---|---|
Historical Comparisons |
|||||
Year ago (3/8/12) |
5-year average (2008-2012) |
||||
| Region | Stocks (Bcf) |
% change |
Stocks (Bcf) |
% change |
|
| East | 1,067 |
-22.2 |
792 |
4.8 |
|
| West | 346 |
-2.0 |
264 |
28.4 |
|
| Producing | 965 |
-20.3 |
684 |
12.4 |
|
| Total | 2,378 |
-18.5 |
1,740 |
11.4 |
|
| Source: U.S. Energy Information Administration | |||||
| Temperature -- Heating & Cooling Degree Days (week ending Mar 07) | ||||||||
|---|---|---|---|---|---|---|---|---|
HDD deviation from: |
CDD deviation from: |
|||||||
| Region | HDD Current |
normal |
last year |
CDD Current |
normal |
last year |
||
| New England | 208
|
-18
|
-12
|
0
|
0
|
0
|
||
| Middle Atlantic | 218
|
5
|
30
|
0
|
0
|
0
|
||
| E N Central | 264
|
39
|
72
|
0
|
-1
|
0
|
||
| W N Central | 267
|
41
|
75
|
0
|
-1
|
0
|
||
| South Atlantic | 177
|
46
|
70
|
0
|
-10
|
-13
|
||
| E S Central | 187
|
61
|
92
|
0
|
-3
|
-4
|
||
| W S Central | 107
|
27
|
61
|
2
|
-7
|
-9
|
||
| Mountain | 161
|
-13
|
-14
|
0
|
-1
|
0
|
||
| Pacific | 83
|
-13
|
-15
|
0
|
-1
|
0
|
||
| United States | 189
|
20
|
41
|
0
|
-3
|
-4
|
||
|
Note: HDD = heating degree-day; CDD = cooling degree-day Source: National Oceanic and Atmospheric Administration | ||||||||
Average temperature (°F)
7-Day Mean ending Mar 07, 2013
Source: NOAA/National Weather Service
Deviation between average and normal (°F)
7-Day Mean ending Mar 07, 2013
Source: NOAA/National Weather Service