In the News:
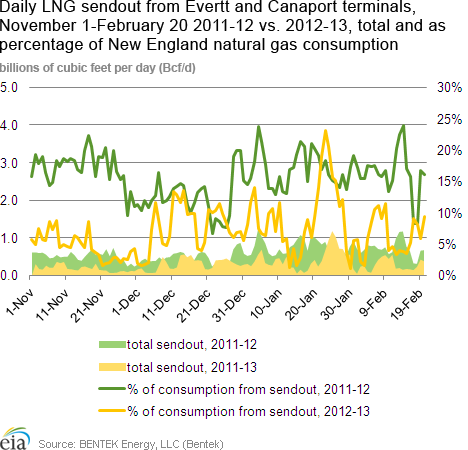
Percentage of New England natural gas consumption from Canaport and Everett LNG sendout less than half of levels last winter
The average percentage of daily natural gas consumption in New England that was met with combined liquefied natural gas (LNG) sendout from the Distrigas of Massachusetts import and regasification facility located in Everett, Massachusetts and the Canaport LNG facility in New Brunswick, Canada through February 20 of the current winter season is less than half of the percentage through February 20 of the previous winter season, according to calculations with estimates from BENTEK Energy, LLC (Bentek). From November 1, 2011 through February 20, 2012, average sendout from the Everett and Canaport terminals was 15.8 percent of average daily consumption in New England, versus an average of 7.4 percent of daily consumption in New England between November 1, 2012 and February 20, 2013, according to the Bentek estimates. By comparison, LNG sendout met over 25 percent of New England's average daily natural gas demand from November 2010 to January 2012.
Part of the reason for the decline in the portion of New England consumption met from Everett and Canaport terminals is that average daily consumption in the region has increased this winter by 3.3 percent, from 3.8 billion cubic feet per day (Bcf/d) in the winter of 2011-12 to 4.0 Bcf/d in the winter of 2012-13. However, another large part of the reason for the decline in the LNG sendout as a percent of consumption is that average daily LNG sendout has fallen by more than half between the two winters, from 0.61 Bcf/d in the winter of 2011-12 to 0.29 Bcf/d in the winter of 2012-13. LNG sendout from Canaport has fallen by 41.9 percent, from 0.39 Bcf/d to 0.23 Bcf/d, while sendout from Everett has fallen by 69.7 percent, from 0.22 Bcf/d to 0.07 Bcf/d.
Overview:
(For the Week Ending Wednesday, February 20, 2013)
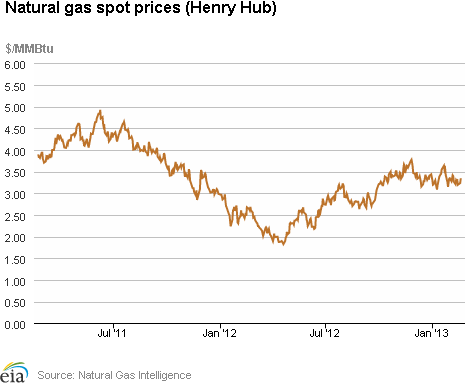
- Natural gas prices were up modestly for most pricing points across the report week (Wednesday to Wednesday). The Henry Hub closed at $3.34 per million British thermal unit (MMBtu) yesterday, up 6 cents per MMBtu for the week. The exceptions were trading points in the Northeast which either remained elevated or saw significant price rises.
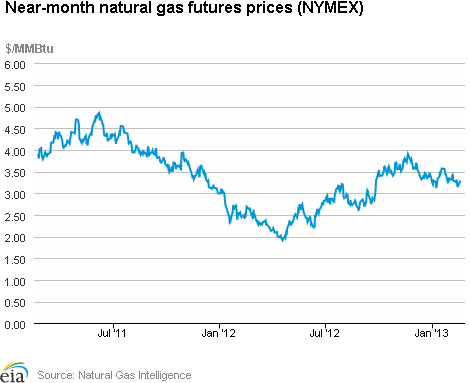
- The March 2013 New York Mercantile Exchange (Nymex) contract decreased slightly, from $3.306 per MMBtu last Wednesday to $3.279 per MMBtu yesterday. The near-month Nymex price ended the report week 6 cents per MMBtu below the Henry Hub price.
- Working natural gas in storage fell last week to 2,400 Bcf as of Friday, February 15, according to the U.S. Energy Information Administration's (EIA) Weekly Natural Gas Storage Report (WNGSR). An implied storage withdrawal of 127 Bcf for the week moved storage levels 242 Bcf below year-ago levels, and 361 Bcf above the 5-year range.
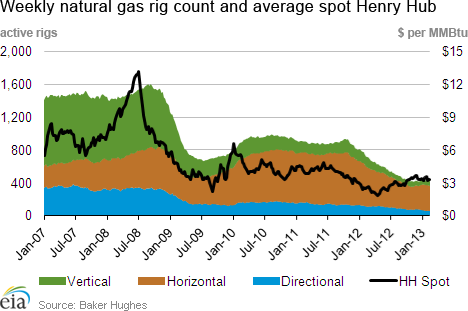
- The Baker Hughes Incorporated natural gas rotary rig fell by 4 units, from 425 to 421 as of Friday, February 15. The average oil rig count increased by 7 units, from 1,330 to 1,337, after falling consistently through late November and December 2012.
Prices:
Natural gas prices were up at most market locations, increasing most significantly in the Northeast. Henry Hub increased from $3.28 per MMBtu last Wednesday to $3.34 yesterday, an increase of 6 cents per MMBtu, or 2 percent. Most trading points increased between 5 and 20 cents per MMBtu week-on-week, with the notable exception of the Northeast. Algonquin Citygate, serving Boston markets, is currently very elevated but fell by 7 percent relative to last week, from $17.85 per MMBtu last Wednesday to $16.55 per MMBtu yesterday. Transco Zone 6 NY, serving New York City, nearly tripled from Wednesday to Wednesday, moving from $6.10 per MMBtu to $17.21 per MMBtu, surpassing Algonquin Citygate on February 20. The Midwest and Northeast faced cold temperatures for the week, and temperatures in the Southeast were low relative to historical norms.
The Nymex futures price fell slightly week-on-week. The near-month Nymex price fell by 3 cents per MMBtu over the report period, from $3.306 per MMBtu last Wednesday to $3.279 per MMBtu yesterday. The Nymex price closed 6 cents per MMBtu below the Henry Hub price yesterday. The 12-Month Strip (average of March 2013 to February 2014 contracts) fell by a similar increment, decreasing by 5 cents per MMBtu over the report period and ending the week at $3.586 per MMBtu. The 24-Month Strip is trading below $4.00 per MMBtu, and also fell by 5 cents per MMBtu for the period, closing at $3.818 per MMBtu yesterday.
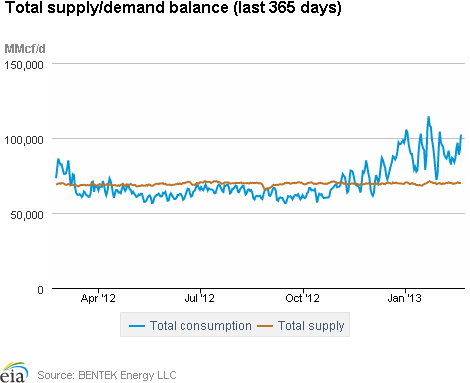
Total demand for the report week was up. According to Bentek estimates, overall natural gas consumption for the nation increased by 6.1 percent. The residential/commercial sector, the biggest gas-consuming sector during the winter, consumed 7.4 percent more natural gas week-on-week. Natural gas consumption for power generation was also up, increasing by 7.3 percent. The Midwest faced colder temperatures week-on-week, consuming 23.6 percent more natural gas for power generation. The Southeast, which consumes the most natural gas for power generation, saw depressed temperatures relative to the 30-year norm, and burned 23.0 percent more natural gas in that sector. West Coast consumers faced relatively warmer temperatures with the Southwest, Pacific Northwest, and Rockies consuming 7.1 percent, 13.8 percent, and 2.1 percent less natural gas for power generation over the report period, respectively.
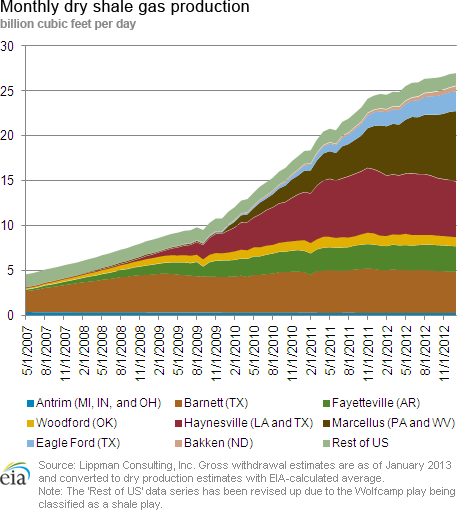
Total supply for the report week was essentially flat. Bentek estimates an overall supply increase of 0.1 percent for the report period. U.S. gross and dry natural gas production were down 0.4 percent. A net increase in imports from Canada of 3.3 percent mostly offset the decrease in production. Driving the increase in imports from Canada was a 25.4 percent rise in imports to the Midwest. LNG imports increased by 50 percent, although they are a very minor contributor to U.S. supply.
Storage
Working natural gas in storage decreased to 2,400 Bcf as of Friday, February 15, according to EIA's WNGSR. This represents an implied net withdrawal of 127 Bcf from the previous week. This week's net withdrawal was 13 Bcf smaller than the 5-year average net withdrawal of 140 Bcf, and 28 Bcf smaller than last year's average net withdrawal of 155 Bcf. Inventories are currently 242 Bcf (9.2 percent) less than last year at this time and 361 Bcf (17.7 percent) greater than the 5-year average of 2,039 Bcf.
All three storage regions posted declines this week. Inventories in the East, West, and Producing regions decreased by 79 Bcf (the 5-year average net withdrawal is 87 Bcf), 13 Bcf (the 5-year average net withdrawal is 15 Bcf), and 35 Bcf (the 5-year average net withdrawal is 38 Bcf), respectively. In the Producing region, working natural gas inventories decreased 9 Bcf (3.8 percent) in salt cavern facilities and decreased 27 Bcf (3.7 percent) in nonsalt cavern facilities.
Temperatures during the storage report week were 2.4 degrees warmer than the 30-year normal temperature and 3.3 degrees warmer than the same period last year. Temperatures in the Lower 48 states averaged 38.3 degrees, compared to 35.0 degrees last year and the 30-year normal of 35.9 degrees. During the week all regions with the exception of the Pacific and Mountain Census divisions were warmer than normal. The West North Central and East North Central Census divisions in the Midwest were relatively warm, averaging 7.0 and 5.9 degrees warmer, respectively, than the 30-year normal. In the West, the Pacific and Mountain Census divisions were relatively cool, averaging 4.6 and 3.9 degrees cooler, respectively, than the 30-year normal. Heating degree-days nationwide were 7.8 percent below normal and 10.0 percent below last year.
See also:
| Spot Prices ($/MMBtu) | Thu, 13-Feb |
Fri, 14-Feb |
Mon, 18-Feb |
Tue, 19-Feb |
Wed, 20-Feb |
|---|---|---|---|---|---|
| Henry Hub | 3.29 |
3.19 |
Holiday |
3.23 |
3.34 |
| New York | 5.13 |
14.63 |
Holiday |
14.02 |
17.21 |
| Chicago | 3.42 |
3.32 |
Holiday |
3.50 |
3.57 |
| Cal. Comp. Avg,* | 3.49 |
3.38 |
Holiday |
3.50 |
3.58 |
| Futures ($/MMBtu) | |||||
| March Contract | 3.163 |
3.153 |
Holiday |
closed |
3.279 |
| April Contract | 3.231 |
3.218 |
Holiday |
3.331 |
3.331 |
| *Avg. of NGI's reported prices for: Malin, PG&E citygate, and Southern California Border Avg. | |||||
| Source: NGI's Daily Gas Price Index | |||||
| U.S. Natural Gas Supply - Gas Week: (2/13/13 - 2/20/13) | ||
|---|---|---|
Percent change for week compared with: |
||
last year |
last week |
|
| Gross Production | 2.00%
|
-0.36%
|
| Dry Production | 1.98%
|
-0.36%
|
| Canadian Imports | 1.49%
|
3.34%
|
| West (Net) | -13.25%
|
-5.31%
|
| MidWest (Net) | 38.56%
|
25.45%
|
| Northeast (Net) | -0.56%
|
-1.46%
|
| LNG Imports | -45.73%
|
50.04%
|
| Total Supply | 1.56%
|
0.06%
|
| Source: BENTEK Energy LLC | ||
| U.S. Consumption - Gas Week: (2/13/13 - 2/20/13) | ||
|---|---|---|
Percent change for week compared with: |
||
last year |
last week |
|
| U.S. Consumption | 9.04%
|
6.12%
|
| Power | -7.96%
|
7.29%
|
| Industrial | 1.88%
|
2.20%
|
| Residential/Commercial | 22.83%
|
7.41%
|
| Total Demand | 9.21%
|
6.04%
|
| Source: BENTEK Energy LLC | ||
| Rigs | |||
|---|---|---|---|
Fri, February 15, 2013 |
Change from |
||
last week |
last year |
||
| Oil Rigs | 1,337 |
0.53% |
5.11% |
| Natural Gas Rigs | 421 |
-0.94% |
-41.20% |
| Miscellaneous | 4 |
0.00% |
-33.33% |
| Rig Numbers by Type | |||
|---|---|---|---|
Fri, February 15, 2013 |
Change from |
||
last week |
last year |
||
| Vertical | 429 |
-0.46% |
-30.47% |
| Horizontal | 1,139 |
-0.35% |
-2.06% |
| Directional | 194 |
4.86% |
-9.35% |
| Source: Baker Hughes Inc. | |||
| Working Gas in Underground Storage | ||||
|---|---|---|---|---|
Stocks billion cubic feet (bcf) |
||||
| Region | 2/15/13
|
2/8/13
|
change |
|
| East | 1,108 |
1,187 |
-79
|
|
| West | 367 |
380 |
-13
|
|
| Producing | 925 |
960 |
-35
|
|
| Total | 2,400 |
2,527 |
-127
|
|
| Source: U.S. Energy Information Administration | ||||
| Working Gas in Underground Storage | |||||
|---|---|---|---|---|---|
Historical Comparisons |
|||||
Year ago (2/15/12) |
5-year average (2008-2012) |
||||
| Region | Stocks (Bcf) |
% change |
Stocks (Bcf) |
% change |
|
| East | 1,260 |
-12.1 |
1,006 |
10.1 |
|
| West | 373 |
-1.6 |
296 |
24.0 |
|
| Producing | 1,010 |
-8.4 |
737 |
25.5 |
|
| Total | 2,642 |
-9.2 |
2,039 |
17.7 |
|
| Source: U.S. Energy Information Administration | |||||
| Temperature -- Heating & Cooling Degree Days (week ending Feb 14) | ||||||||
|---|---|---|---|---|---|---|---|---|
HDD deviation from: |
CDD deviation from: |
|||||||
| Region | HDD Current |
normal |
last year |
CDD Current |
normal |
last year |
||
| New England | 261
|
-4
|
17
|
0
|
0
|
0
|
||
| Middle Atlantic | 236
|
-16
|
-2
|
0
|
0
|
0
|
||
| E N Central | 233
|
-41
|
-43
|
0
|
0
|
0
|
||
| W N Central | 230
|
-49
|
-67
|
0
|
0
|
0
|
||
| South Atlantic | 138
|
-28
|
-47
|
12
|
5
|
8
|
||
| E S Central | 131
|
-34
|
-71
|
0
|
0
|
0
|
||
| W S Central | 87
|
-26
|
-63
|
2
|
-2
|
2
|
||
| Mountain | 233
|
26
|
31
|
0
|
-1
|
0
|
||
| Pacific | 137
|
32
|
39
|
0
|
0
|
0
|
||
| United States | 189
|
-16
|
-21
|
2
|
1
|
2
|
||
|
Note: HDD = heating degree-day; CDD = cooling degree-day Source: National Oceanic and Atmospheric Administration | ||||||||
Average temperature (°F)
7-Day Mean ending Feb 14, 2013
Source: NOAA/National Weather Service
Deviation between average and normal (°F)
7-Day Mean ending Feb 14, 2013
Source: NOAA/National Weather Service