In the News:
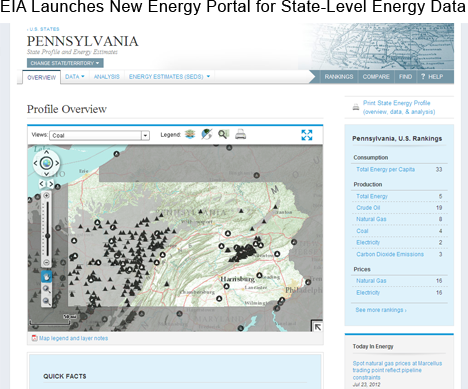
EIA Launches New Energy Portal for State-Level Energy Data
On October 22, the U.S. Energy Information Administration (EIA) launched a new interactive web portal for state-level energy data and infrastructure. The new web portal, which includes a profile analysis for each state, allows users to compare state rankings of energy consumption, production, and prices across fuels and sectors; customize energy maps with over 30 selectable layers; visualize state-level data with graphics and charts; and analyze key energy facts for each state. A large amount of state-specific natural gas data and information may be found on the portal. Additionally, natural gas infrastructure, including pipelines and gas processing plants, can be added to interactive maps.The homepage of the web portal includes an interactive help function that explains the navigation, along with a video demonstration of the new features. The portal is currently launched through EIA's Beta website for testing by users. Feedback on the navigation, datasets, or usability is welcome.
Overview:
(For the Week Ending Wednesday, October 24, 2012)
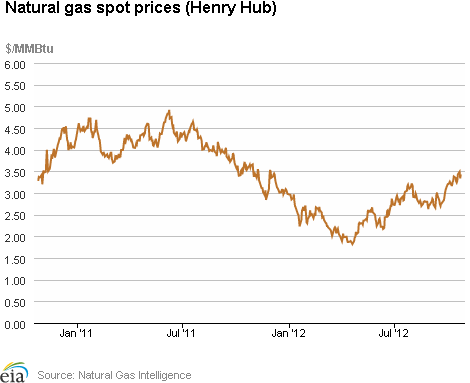
- Natural gas prices posted increases at most trading locations across the week (Wednesday to Wednesday). The Henry Hub closed at $3.43 per million British thermal units (MMBtu) yesterday, up 19 cents per MMBtu for the week. Trading points in Southern California ended flat or slightly down.
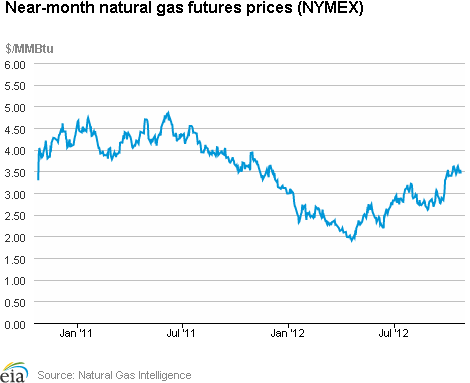
- The November 2012 New York Mercantile Exchange (NYMEX) contract fell from $3.470 per MMBtu last Wednesday to close at $3.450 per MMBtu yesterday.
- Working natural gas in storage rose last week to 3,843 billion cubic feet (Bcf) as of Friday, October 19, according to EIA's Weekly Natural Gas Storage Report (WNGSR). An implied storage build of 67 Bcf for the week moved storage levels 153 Bcf above year-ago levels.
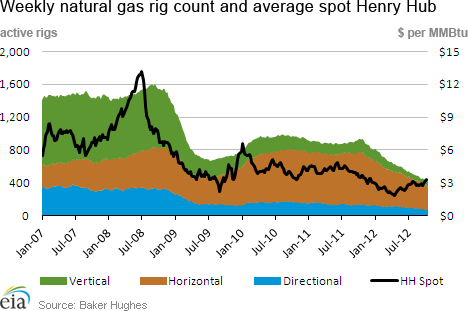
- The Baker Hughes Incorporated natural gas rotary rig count rose by 5 to 427 active units on the week ending October 19. The oil-directed rig count decreased by 1 to 1,410 units.
Prices:
Natural gas prices rose across most spot market locations. Henry Hub rose from $3.24 per MMBtu last Wednesday to $3.43 per MMBtu yesterday, an increase of 19 cents per MMBtu, or 6 percent. Many trading points increased by around 20 cents per MMBtu, due mostly to a large bounce from Tuesday to Wednesday (yesterday) on news of a coming cold-snap. Southern California spot prices were flat or slightly falling, with SoCal Citygate closing the week at $3.72 per MMBtu, down 4 cents per MMBtu.
The NYMEX futures price decreased slightly week-on-week, closing close to spot prices. The NYMEX price fell 2 cents per MMBtu, from $3.470 per MMBtu last Wednesday to $3.450 per MMBtu yesterday. The futures price began the week 23 cents per MMBtu above the Henry Hub price, and closed to just 2 cents per MMBtu above it as of yesterday. The 12-Month Strip (Average of November 2012 to October 2013 contracts) also fell, dropping 4.7 cents per MMBtu over the report period and ending the week at $3.861 per MMBtu.
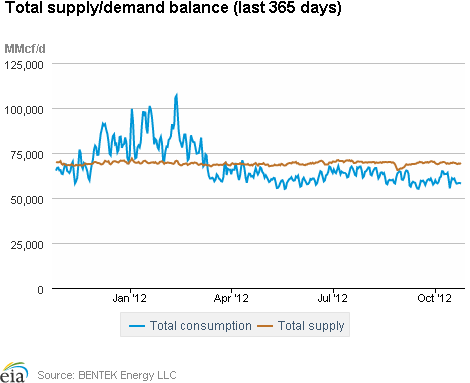
Total demand for the report week showed an overall decrease. According to BENTEK Energy LLC (Bentek) estimates, overall natural gas demand for the nation fell by 2.9 percent. NOAA reports above-average temperatures in the Northeast over the week, which reduced demand for residential heating. Residential and commercial natural gas consumption was down 4.8 percent compared to the previous report week. Similarly, mild temperatures in the southern United States reduced demand for home cooling. This pushed natural gas consumed in the electric power sector down 2.8 percent. The Southwest, Texas, and the Southeast all consumed less natural gas for power, showing power demand reductions of 7.4 percent, 5.9 percent, and 3.2 percent, respectively. Industrial demand was also slightly down, falling by 0.9 percent over the report period.
Total supply for the report week showed a slight decrease, despite production growth. According to estimates from Bentek, overall supply declined 0.1 percent, driven by reduced imports from Canada, which fell by 4.7 percent. The western United States, which imports more natural gas on a net basis than the Midwest or the Northeast, saw imports fall by 6.5 percent week-on-week. Reduced imports from Canada offset modest additional supply from production, which grew by 0.3 percent.
Storage
Working natural gas in storage increased to 3,843 Bcf as of Friday, October 19, according to EIA's WNGSR. This represents an implied net injection of 67 Bcf from the previous week. This week's injection was 2 Bcf above the 5-year (2007-2011) average injection of 65 Bcf, and 28 Bcf below last year's injection of 95 Bcf. Inventories are currently 153 Bcf (4.1 percent) greater than last year at this time and 251 Bcf (7.0 percent) greater than the 5-year average.
All three storage regions posted increases this week. Inventories in the East, West, and Producing regions increased by 28 Bcf (the 5-year average net injection is 35 Bcf), 11 Bcf (the 5-year average net injection is 6 Bcf), and 28 Bcf (the 5-year average net injection is 25 Bcf), respectively. In the Producing region, working natural gas inventories increased 15 Bcf (5.5 percent) in salt cavern facilities and increased 13 Bcf (1.4 percent) in nonsalt cavern facilities.
Temperatures during the storage report week were 1.1 degrees warmer than the 30-year normal temperature and 1.3 degrees cooler than the same period last year. Temperatures in the lower 48 States averaged 58.3 degrees, compared to 59.6 last year and the 30-year normal of 57.1 degrees. While overall temperatures were about a degree warmer than normal, temperatures varied somewhat across Census divisions. In the South, the West South Central Census division was particularly warm, averaging 4.0 degrees warmer than the 30-year normal. In the Northeast, the New England Census division was relatively cool, averaging about a degree cooler than the 30-year normal. Heating degree-days nationwide were 7.5 percent below normal and 19.2 percent above last year.
See also:
| Spot Prices ($/MMBtu) | Thu, 18-Oct |
Fri, 19-Oct |
Mon, 22-Oct |
Tue, 23-Oct |
Wed, 24-Oct |
|---|---|---|---|---|---|
| Henry Hub | 3.28 |
3.43 |
3.49 |
3.34 |
3.43 |
| New York | 3.48 |
3.48 |
3.61 |
3.49 |
3.60 |
| Chicago | 3.56 |
3.54 |
3.53 |
3.41 |
3.64 |
| Cal. Comp. Avg,* | 3.68 |
3.76 |
3.79 |
3.68 |
3.74 |
| Futures ($/MMBtu) | |||||
| November Contract | 3.587 |
3.617 |
3.452 |
3.535 |
3.450 |
| December Contract | 3.904 |
3.947 |
3.768 |
3.861 |
3.776 |
| *Avg. of NGI's reported prices for: Malin, PG&E citygate, and Southern California Border Avg. | |||||
| Source: NGI's Daily Gas Price Index | |||||
| U.S. Natural Gas Supply - Gas Week: (10/17/12 - 10/24/12) | ||
|---|---|---|
Percent change for week compared with: |
||
last year |
last week |
|
| Gross Production | 1.09%
|
0.27%
|
| Dry Production | 1.08%
|
0.27%
|
| Canadian Imports | -7.93%
|
-4.73%
|
| West (Net) | 5.71%
|
-6.55%
|
| MidWest (Net) | -18.39%
|
-2.76%
|
| Northeast (Net) | -8.82%
|
-4.79%
|
| LNG Imports | -70.13%
|
-4.42%
|
| Total Supply | -0.35%
|
-0.12%
|
| Source: BENTEK Energy LLC | ||
| U.S. Consumption - Gas Week: (10/17/12 - 10/24/12) | ||
|---|---|---|
Percent change for week compared with: |
||
last year |
last week |
|
| U.S. Consumption | 0.37%
|
-2.78%
|
| Power | 17.73%
|
-2.83%
|
| Industrial | 0.28%
|
-0.88%
|
| Residential/Commercial | -15.74%
|
-4.80%
|
| Total Demand | 1.56%
|
-2.87%
|
| Source: BENTEK Energy LLC | ||
| Rigs | |||
|---|---|---|---|
Fri, October 19, 2012 |
Change from |
||
last week |
last year |
||
| Oil Rigs | 1,410 |
-0.07% |
30.68% |
| Natural Gas Rigs | 427 |
1.18% |
-53.94% |
| Miscellaneous | 2 |
0.00% |
-71.43% |
| Rig Numbers by Type | |||
|---|---|---|---|
Fri, October 19, 2012 |
Change from |
||
last week |
last year |
||
| Vertical | 525 |
-0.76% |
-16.67% |
| Horizontal | 1,114 |
0.18% |
-2.45% |
| Directional | 200 |
3.09% |
-17.01% |
| Source: Baker Hughes Inc. | |||
| Working Gas in Underground Storage | ||||
|---|---|---|---|---|
Stocks billion cubic feet (bcf) |
||||
| Region | 10/19/12
|
10/12/12
|
change |
|
| East | 2,057 |
2,029 |
28
|
|
| West | 532 |
521 |
11
|
|
| Producing | 1,254 |
1,226 |
28
|
|
| Total | 3,843 |
3,776 |
67
|
|
| Source: U.S. Energy Information Administration | ||||
| Working Gas in Underground Storage | |||||
|---|---|---|---|---|---|
Historical Comparisons |
|||||
Year ago (10/19/11) |
5-year average (2007-2011) |
||||
| Region | Stocks (Bcf) |
% change |
Stocks (Bcf) |
% change |
|
| East | 2,024 |
1.6 |
2,013 |
2.2 |
|
| West | 496 |
7.3 |
483 |
10.1 |
|
| Producing | 1,169 |
7.3 |
1,096 |
14.4 |
|
| Total | 3,690 |
4.1 |
3,592 |
7.0 |
|
| Source: U.S. Energy Information Administration | |||||
| Temperature -- Heating & Cooling Degree Days (week ending Oct 18) | ||||||||
|---|---|---|---|---|---|---|---|---|
HDD deviation from: |
CDD deviation from: |
|||||||
| Region | HDD Current |
normal |
last year |
CDD Current |
normal |
last year |
||
| New England | 105
|
6
|
53
|
0
|
0
|
0
|
||
| Middle Atlantic | 92
|
4
|
45
|
0
|
-1
|
0
|
||
| E N Central | 89
|
-5
|
0
|
0
|
-2
|
0
|
||
| W N Central | 83
|
-7
|
-21
|
0
|
-2
|
0
|
||
| South Atlantic | 48
|
0
|
27
|
27
|
0
|
0
|
||
| E S Central | 35
|
-12
|
-4
|
9
|
-3
|
4
|
||
| W S Central | 8
|
-9
|
-10
|
49
|
19
|
17
|
||
| Mountain | 75
|
-13
|
3
|
11
|
-1
|
-13
|
||
| Pacific | 21
|
-12
|
8
|
19
|
11
|
-5
|
||
| United States | 62
|
-5
|
10
|
15
|
3
|
1
|
||
|
Note: HDD = heating degree-day; CDD = cooling degree-day Source: National Oceanic and Atmospheric Administration | ||||||||
Average temperature (°F)
7-Day Mean ending Oct 18, 2012
Source: NOAA/National Weather Service
Deviation between average and normal (°F)
7-Day Mean ending Oct 18, 2012
Source: NOAA/National Weather Service