In the News:
First taste of cooler weather evidenced by uptick in residential/commercial natural gas consumption over last two reporting weeks.
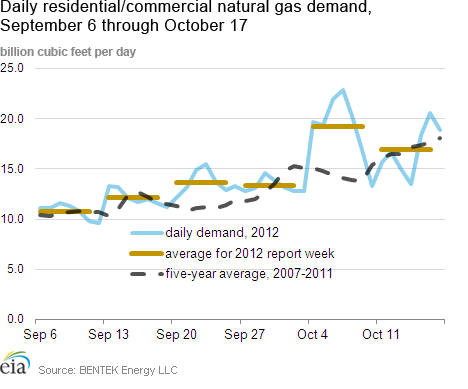
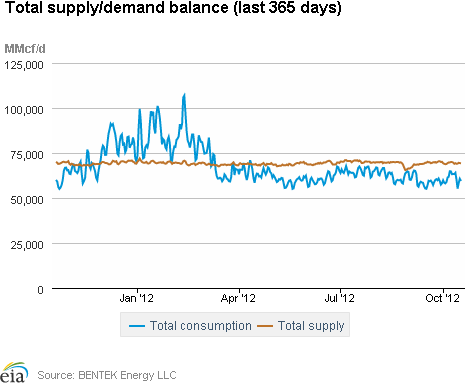
An uptick in residential/commercial natural gas consumption took place over the last two reporting weeks, according to estimates from BENTEK Energy LLC (Bentek) signaling the arrival of cooler temperatures and increased natural gas demand for heating homes and businesses.The increase in daily consumption began over Columbus Day weekend. Residential/commercial consumption began the last report week on Thursday, October 4 at 13.3 billion cubic feet (Bcf) per day, rising to 16.9 Bcf per day on Friday, October 5. Consumption rose to 20.3 Bcf per day on Saturday, October 6, and peaked at 22.9 Bcf per day on Sunday, October 7, 62.1 percent above the five-year daily average, according to Bentek. This marked the first time that average residential/commercial consumption topped 20.0 Bcf per day in over five months, but it was still well below the 50.0 Bcf per day January average for 2007-2011. Consumption during the last report week averaged 19.2 Bcf per day, a six-month high. For the most recent report week, consumption averaged 17.0 Bcf per day, a decline from the previous week but still significantly above September levels.
This increase in demand took place alongside a cooling in national temperatures. According to National Oceanic and Atmospheric Administration (NOAA), the mean national temperature for the week ending on Saturday, October 13 fell to 54.8 degrees Fahrenheit. This reflected a 7.6 percent decline from the previous week's national mean temperature of 59.3 degrees Fahrenheit. The biggest drops occurred in the Northeast Climate region, where the mean temperature fell week-on-week by 14.3 percent to 50.0 degrees Fahrenheit, and the East North Central Climate region, where the mean temperature fell week-on-week by 12.0 percent to 44.9 degrees Fahrenheit.
Overview:
(For the Week Ending Wednesday, October 17, 2012)
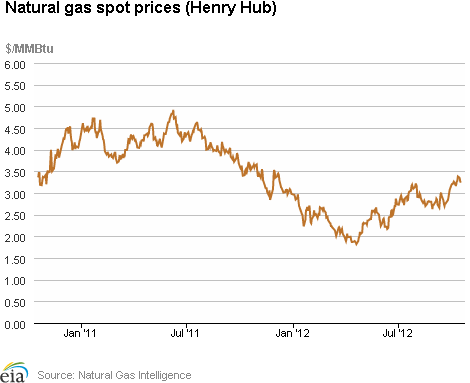
- Natural gas price changes were mixed over the report week (Wednesday, October 10 through Wednesday, October 17). The natural gas spot price at the Henry Hub posted a net loss of 2 cents, from $3.26 per million British thermal units (MMBtu) last Wednesday to $3.24 per MMBtu yesterday.
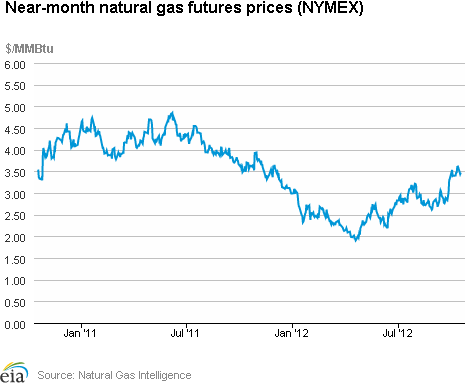
- After increasing during intra-week trading, the November 2012 New York Mercantile Exchange (NYMEX) near-month contract ended the week essentially unchanged at $3.470 per MMBtu yesterday, a decline of half a cent per MMBtu from the previous Wednesday.
- Working natural gas in storage rose last week to 3,776 billion cubic feet (Bcf) as of Friday, October 12, according to the U.S. Energy Information Administration's (EIA) Weekly Natural Gas Storage Report (WNGSR). An implied storage build of 51 Bcf for the week positioned storage volumes 181 Bcf above year-ago levels.
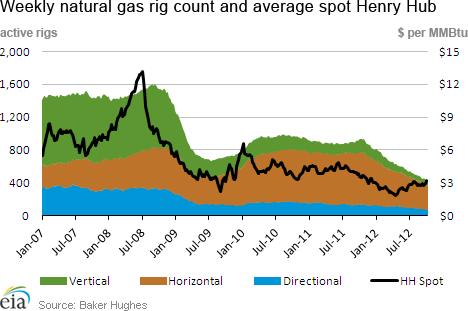
- The natural gas rotary rig count, as reported by Baker Hughes Incorporated, declined by 15 rigs to 422 active units as of Friday, October 12. The oil rig count rose to 1,411 rigs, an increase of 13 from the previous week.
Prices:
Natural gas spot price changes were mixed over the report week, with large net increases in some Western markets, and some small overall declines at points in the Mid-Atlantic states and the Gulf Coast. The Henry Hub spot price declined 2 cents overall, from $3.26 per MMBtu last Wednesday to $3.24 per MMBtu yesterday. However, the Henry Hub price had edged up to $3.38 per MMBtu on Friday, before falling back down.
Price changes varied widely among the Northeastern states. At Transcontinental Pipeline's Zone 6 trading point for delivery into New York City, prices remained mostly in the $3.40 - $3.50 per MMBtu range for the report week, beginning the week at $3.46 per MMBtu and ending at $3.43 per MMBtu. On the other hand, New England prices were more varied during the report week. The spot price at the Algonquin Citygate, which serves Boston consumers, swung up to $4.44 per MMBtu in trading on Tuesday, before dropping back to end the week at $3.88 per MMBtu yesterday. Overall, the Algonquin Citygate posted a net increase of 27 cents per MMBtu. The mid-week increases were likely the result of infrastructure constraints on Algonquin Gas Transmission's system. The 56-cent per MMBtu drop on the last trading day of the report week likely reflected forecasts for mild weather in New England this weekend.
A heat wave in the West drove California prices upward. With forecast temperatures in the 90s for some parts of California and Arizona, prices at the major trading points in the West increased substantially over the report week. The Southern California Citygate price increased 23 cents per MMBtu over the report week, and pricing points in Arizona and New Mexico also saw double-digit increases. Also likely playing a role in price increases were infrastructure constraints; SoCal Gas reduced capacity after declaring force majeure this week due to a maintenance issue at a receipt point in South Needles, California.
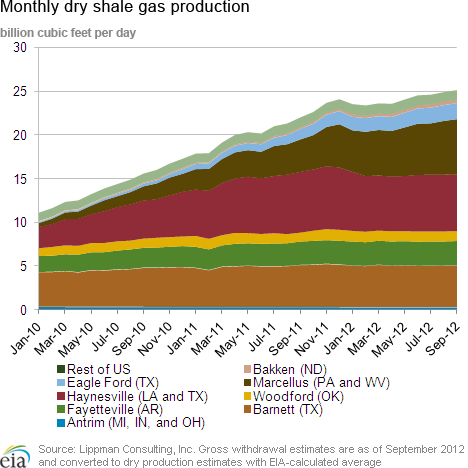
Overall natural gas supply declined slightly this week, according to data from Bentek. Dry production declined by 0.2 percent, and imports from Canada fell 5.2 percent. Liquefied natural gas (LNG) imports increased 12.7 percent this week, but averaged 220 million cubic feet per day, remaining a very small portion of the United States' total supply.
Overall natural gas consumption dropped by 4 percent, as declines occurred in most major consuming sectors. Consumption of natural gas for electric power generation fell 2.7 percent, while residential and commercial use declined 9.5 percent due to weather-related demand declines. Consumption increased 0.2 percent in the industrial sector.
At the NYMEX, the price of the near-month (November 2012) contract was essentially unchanged this report week. The contract fell slightly from $3.475 per MMBtu last Wednesday to $3.470 per MMBtu yesterday. Similar to the Henry Hub spot price, the futures contract rose about 13.6 cents from Wednesday to Friday. The price of the 12-month strip (the average of futures contracts from November 2012 – October 2013) increased to $3.908 per MMBtu from $3.890 per MMBtu last Wednesday
Storage
Working natural gas in storage increased to 3,776 Bcf as of Friday, October 12, according to EIA's WNGSR. This represents an implied net injection of 51 Bcf from the previous week. This week's injection was 20 Bcf below the 5-year (2007-2011) average injection of 71 Bcf, and 55 Bcf below last year's injection of 106 Bcf. Inventories are currently 181 Bcf (5.0 percent) greater than last year at this time and 249 Bcf (7.1 percent) greater than the 5-year average.
All three storage regions posted increases this week. Inventories in the East, West, and Producing regions increased by 24 Bcf (the 5-year average net injection is 40 Bcf), 8 Bcf (the 5-year average net injection is 6 Bcf), and 19 Bcf (the 5-year average net injection is 24 Bcf), respectively. In the Producing region, working natural gas inventories increased 11 Bcf (4.2 percent) in salt cavern facilities and increased 8 Bcf (0.8 percent) in nonsalt cavern facilities.
Temperatures during the storage report week were 4.6 degrees cooler than the 30-year normal temperature and 7.4 degrees cooler than the same period last year. Temperatures in the lower 48 States averaged 55.0 degrees, compared to 62.4 last year and the 30-year normal of 59.6 degrees. During the week, all but one of the Census divisions were cooler than the 30-year normal, particularly the West North Central and East North Central Census divisions in the Midwest, which averaged 11.1 and 8.6 degrees, respectively, cooler than the 30-year normal. In the Northeast, the New England Census division was relatively warm, averaging about a degree warmer than the 30-year normal. Heating degree-days nationwide were 50 percent above normal and 153 percent above last year.
See also:
| Spot Prices ($/MMBtu) | Thu, 11-Oct |
Fri, 12-Oct |
Mon, 15-Oct |
Tue, 16-Oct |
Wed, 17-Oct |
|---|---|---|---|---|---|
| Henry Hub | 3.28 |
3.38 |
3.35 |
3.27 |
3.24 |
| New York | 3.52 |
3.46 |
3.48 |
3.45 |
3.43 |
| Chicago | 3.47 |
3.51 |
3.48 |
3.38 |
3.44 |
| Cal. Comp. Avg,* | 3.68 |
3.73 |
3.73 |
3.65 |
3.67 |
| Futures ($/MMBtu) | |||||
| November Contract | 3.604 |
3.611 |
3.486 |
3.437 |
3.470 |
| December Contract | 3.900 |
3.877 |
3.774 |
3.767 |
3.820 |
| *Avg. of NGI's reported prices for: Malin, PG&E citygate, and Southern California Border Avg. | |||||
| Source: NGI's Daily Gas Price Index | |||||
| U.S. Natural Gas Supply - Gas Week: (10/10/12 - 10/17/12) | ||
|---|---|---|
Percent change for week compared with: |
||
last year |
last week |
|
| Gross Production | 0.60%
|
-0.25%
|
| Dry Production | 0.59%
|
-0.25%
|
| Canadian Imports | -8.84%
|
-5.16%
|
| West (Net) | 6.43%
|
-6.85%
|
| MidWest (Net) | -20.61%
|
-6.54%
|
| Northeast (Net) | -9.89%
|
5.87%
|
| LNG Imports | -65.75%
|
12.67%
|
| Total Supply | -0.79%
|
-0.60%
|
| Source: BENTEK Energy LLC | ||
| U.S. Consumption - Gas Week: (10/10/12 - 10/17/12) | ||
|---|---|---|
Percent change for week compared with: |
||
last year |
last week |
|
| U.S. Consumption | 8.62%
|
-3.96%
|
| Power | 5.25%
|
-2.68%
|
| Industrial | 4.67%
|
0.23%
|
| Residential/Commercial | 18.32%
|
-9.48%
|
| Total Demand | 9.67%
|
-3.94%
|
| Source: BENTEK Energy LLC | ||
| Rigs | |||
|---|---|---|---|
Fri, October 12, 2012 |
Change from |
||
last week |
last year |
||
| Oil Rigs | 1,411 |
0.93% |
30.65% |
| Natural Gas Rigs | 422 |
-3.43% |
-54.91% |
| Miscellaneous | 2 |
0.00% |
-71.43% |
| Rig Numbers by Type | |||
|---|---|---|---|
Fri, October 12, 2012 |
Change from |
||
last week |
last year |
||
| Vertical | 529 |
3.52% |
-14.68% |
| Horizontal | 1,112 |
-1.77% |
-3.56% |
| Directional | 194 |
0.00% |
-22.40% |
| Source: Baker Hughes Inc. | |||
| Working Gas in Underground Storage | ||||
|---|---|---|---|---|
Stocks billion cubic feet (bcf) |
||||
| Region | 10/12/12
|
10/5/12
|
change |
|
| East | 2,029 |
2,005 |
24
|
|
| West | 521 |
513 |
8
|
|
| Producing | 1,226 |
1,207 |
19
|
|
| Total | 3,776 |
3,725 |
51
|
|
| Source: U.S. Energy Information Administration | ||||
| Working Gas in Underground Storage | |||||
|---|---|---|---|---|---|
Historical Comparisons |
|||||
Year ago (10/12/11) |
5-year average (2007-2011) |
||||
| Region | Stocks (Bcf) |
% change |
Stocks (Bcf) |
% change |
|
| East | 1,976 |
2.7 |
1,978 |
2.6 |
|
| West | 488 |
6.8 |
477 |
9.2 |
|
| Producing | 1,130 |
8.5 |
1,071 |
14.5 |
|
| Total | 3,595 |
5.0 |
3,527 |
7.1 |
|
| Source: U.S. Energy Information Administration | |||||
| Temperature -- Heating & Cooling Degree Days (week ending Oct 11) | ||||||||
|---|---|---|---|---|---|---|---|---|
HDD deviation from: |
CDD deviation from: |
|||||||
| Region | HDD Current |
normal |
last year |
CDD Current |
normal |
last year |
||
| New England | 77
|
-6
|
18
|
0
|
0
|
0
|
||
| Middle Atlantic | 81
|
9
|
44
|
1
|
-1
|
0
|
||
| E N Central | 132
|
57
|
108
|
0
|
-3
|
-2
|
||
| W N Central | 146
|
74
|
126
|
0
|
-4
|
-10
|
||
| South Atlantic | 49
|
13
|
24
|
35
|
1
|
8
|
||
| E S Central | 67
|
32
|
51
|
3
|
-15
|
-6
|
||
| W S Central | 37
|
27
|
34
|
26
|
-14
|
-32
|
||
| Mountain | 90
|
17
|
-3
|
19
|
1
|
13
|
||
| Pacific | 22
|
-3
|
-14
|
2
|
-11
|
-4
|
||
| United States | 81
|
27
|
49
|
11
|
-5
|
-3
|
||
|
Note: HDD = heating degree-day; CDD = cooling degree-day Source: National Oceanic and Atmospheric Administration | ||||||||
Average temperature (°F)
7-Day Mean ending Oct 11, 2012
Source: NOAA/National Weather Service
Deviation between average and normal (°F)
7-Day Mean ending Oct 11, 2012
Source: NOAA/National Weather Service