In the News:
EIA's Winter Fuels Outlook Projects Higher Heating Expenditures.
The U.S. Energy Information Administration (EIA) projects that household consumption of all heating fuels will increase this winter, as temperatures are expected to be close to normal. Last year's unusually warm winter resulted in relatively low consumption of the primary space heating energy sources, including natural gas, propane, heating oil, and electricity.
EIA's Winter Fuels Outlook projects that overall consumption of natural gas for space heating this winter (October 2012 – March 2013) will increase 13.8 percent nationwide, with the largest increases east of the Mississippi River. Residential prices are expected to rise slightly (0.8 percent), but weather-related increases in consumption are expected to be the primary driver of increases in household expenditures for natural gas.
Natural gas is the most widely used source for household space heating, with 58.3 million homes relying on natural gas heating, while 43.8 million homes heat with electricity, 7.2 million with heating oil, 5.7 million with propane, and 2.5 million with wood.
Overview:
(For the Week Ending Wednesday, October 10, 2012)
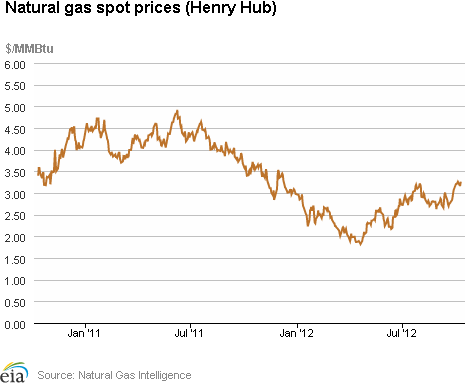
- Natural gas price changes at key trading points were mixed for the report week (Wednesday to Wednesday). The Henry Hub spot price closed at $3.26 per million British thermal units (MMBtu) yesterday, up 5 cents per MMBtu for the week. Spot prices rose in the Midwest, Rocky Mountains, and Pacific Northwest, while falling in Southern California and remaining unchanged in the Northeast.
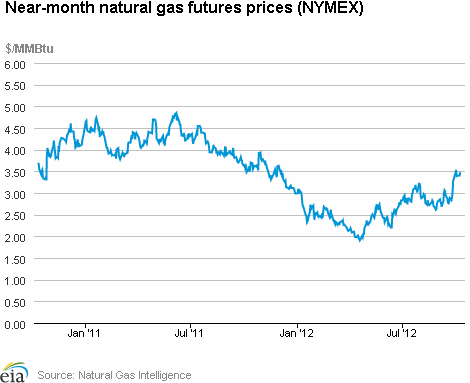
- The November 2012 New York Mercantile Exchange (NYMEX) edged upwards by 8 cents per MMBtu, from $3.395 per MMBtu last Wednesday to $3.475 per MMBtu yesterday.
- Working natural gas in storage rose last week to 3,725 billion cubic feet (Bcf) as of Friday, October 5, according to EIA's Weekly Natural Gas Storage Report (WNGSR). An implied storage build of 72 Bcf for the week moved storage levels 236 Bcf above year-ago levels.
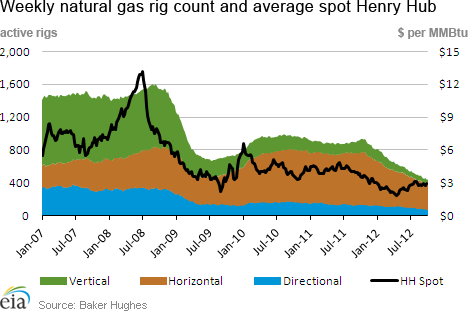
- The Baker Hughes Incorporated natural gas rotary rig count increased by 2 to 437 active units on the week ending October 5. The oil-directed rig count fell by 12 to 1,398 units.
Prices:
Natural gas prices rise in Midwest, Rocky Mountains, and Pacific Northwest, fall in California. The Henry Hub spot price rose from $3.21 per MMBtu last Wednesday to $3.26 yesterday, an increase of 5 cents per MMBtu, or 1.5 percent.
Spot prices at the Chicago Citygate (Midwest), Kern River (Rocky Mountains), and Northwest Sumas (Pacific Northwest) trading points increased for the week ending yesterday by 12 cents, 17 cents, and 20 cents per MMBtu, respectively. These increases were a less pronounced continuation of those seen last week at these trading points, likely due to cooling temperatures.
By contrast, spot prices in Southern California fell, while prices remained flat in the Northeast, following increases seen last week for both of these regions. The Southern California Border Average and SoCal Citygate trading points closed trading yesterday with prices down for the week by 8 cents and 9 cents per MMBtu, respectively, following last week's respective increases of 28 cents and 30 cents per MMBtu. Algonquin Citygate – a trading point for delivery into the Boston area – saw its spot price close Wednesday at $3.61 per MMBtu, essentially unchanged following last week's 41 cent per MMBtu increase. Similarly, the spot price at the New York area's Transco Zone 6 trading point closed this week up 4 cents per MMBtu at $3.46 per MMBtu, following last week's 35 cent per MMBtu increase.
The NYMEX futures price increased modestly, Henry Hub spread widens by end of week. The NYMEX November futures price rose from $3.395 per MMBtu last Wednesday to $3.475 per MMBtu yesterday. The futures price closed at $3.396 per MMBtu on Friday, a spread of 14 cents over the Henry Hub daily spot price. At the close of trading yesterday, the NYMEX spread over the Henry Hub daily spot price was 22 cents, 58.1 percent higher than on Friday, and 16.2 percent above the spread from the previous Wednesday (October 3). The 12-Month Strip (average of November 2012 to October 2013 contracts) gained 12 cents per MMBtu, starting at $3.771 per MMBtu last Wednesday and landing at $3.890 per MMBtu yesterday.
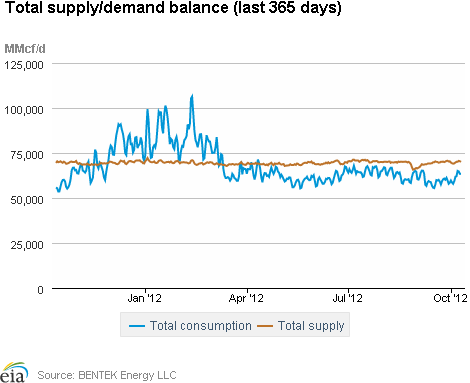
Total demand boosted by increased residential/commercial consumption. According to estimates from BENTEK Energy LLC (Bentek), average natural gas consumption for the nation rose this report week by 3.5 Bcf per day (5.9 percent) over the last week's daily average. The rise resulted principally from a 5.9 Bcf per day (44.2 percent) week-on-week increase in average residential/commercial consumption, likely due to increased space heating consumption. Bentek also estimated slight increases for industrial and Mexican export sector consumption. Together, these increases far exceeded a 2.9 Bcf per day (11.8 percent) drop in power sector consumption below last week's daily average.
This week's increase in residential/commercial consumption began on Friday October 5, when consumption reached 16.9 Bcf per day. Residential/commercial consumption peaked on Monday October 8 (Columbus Day) at 22.0 Bcf per day. It remained at 19.4 Bcf per day on Tuesday October 9 and 19.7 Bcf per day on Wednesday October 10.
By contrast, power sector consumption fell this report week by 2.9 Bcf per day (11.8 percent) below last week's daily average, as average temperatures cooled. Power burn fell week-on-week in all eight regions. The largest decline came from the Southwest, where average power burn fell by 1.4 Bcf per day (28.6 percent), followed by respective declines of 0.5 Bcf per day for both Texas and the Southeast (13.4 percent and 6.4 percent, respectively).
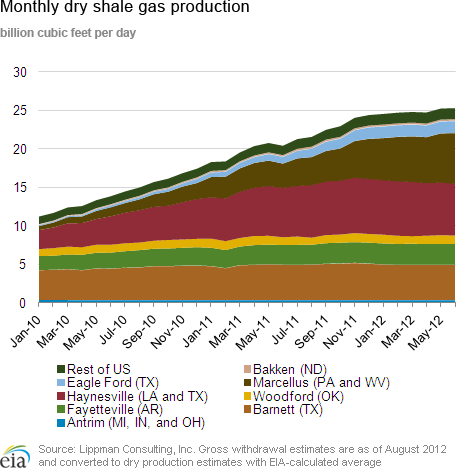
Total supply remained essentially flat. Bentek estimates that average daily natural gas supply for this report week was essentially equal to the daily average for last week. A 0.1 Bcf per day (2.6 percent) increase in imports from Canada was mostly offset by a 0.1 Bcf per day (0.2 percent) decline in dry production.
Storage
Working natural gas in storage increased to 3,725 Bcf as of Friday, October 5, according to EIA's WNGSR. This represents an implied net injection of 72 Bcf from the previous week. This week's injection was 12 Bcf below the 5-year (2007-2011) average injection of 84 Bcf, and 36 Bcf below last year's injection of 108 Bcf. Inventories are currently 236 Bcf (6.8 percent) greater than last year at this time and 269 Bcf (7.8 percent) greater than the 5-year average.
All three storage regions posted increases this week. Inventories in the East, West, and Producing regions increased by 42 Bcf (the 5-year average net injection is 45 Bcf), 3 Bcf (the 5-year average net injection is 8 Bcf), and 27 Bcf (the 5-year average net injection is 30 Bcf), respectively. In the Producing region, working natural gas inventories increased 15 Bcf (6.1 percent) in salt cavern facilities and increased 12 Bcf (1.3 percent) in nonsalt cavern facilities.
Temperatures during the storage report week were 2.6 degrees warmer than the 30-year normal temperature and 2.6 degrees warmer than the same period last year. Temperatures in the lower 48 States averaged 64.7 degrees, compared to 62.1 last year and the 30-year normal of 62.1 degrees. While overall temperatures were a few degrees warmer than normal, temperatures varied somewhat across Census divisions. The Pacific and Mountain Census divisions in the West were particularly warm, averaging 6.7 and 4.6 degrees, respectively, warmer than the 30-year normal. In the South, the West South Central Census division was relatively cool, averaging a degree cooler than the 30-year normal.
See also:
| Spot Prices ($/MMBtu) | Thu, 04-Oct |
Fri, 05-Oct |
Mon, 08-Oct |
Tue, 09-Oct |
Wed, 10-Oct |
|---|---|---|---|---|---|
| Henry Hub | 3.23 |
3.26 |
3.18 |
3.18 |
3.26 |
| New York | 3.47 |
3.45 |
3.36 |
3.40 |
3.46 |
| Chicago | 3.43 |
3.41 |
3.29 |
3.39 |
3.43 |
| Cal. Comp. Avg,* | 3.55 |
3.49 |
3.46 |
3.54 |
3.57 |
| Futures ($/MMBtu) | |||||
| November Contract | 3.406 |
3.396 |
3.403 |
3.467 |
3.475 |
| December Contract | 3.680 |
3.682 |
3.697 |
3.768 |
3.783 |
| *Avg. of NGI's reported prices for: Malin, PG&E citygate, and Southern California Border Avg. | |||||
| Source: NGI's Daily Gas Price Index | |||||
| U.S. Natural Gas Supply - Gas Week: (10/3/12 - 10/10/12) | ||
|---|---|---|
Percent change for week compared with: |
||
last year |
last week |
|
| Gross Production | 1.58%
|
-0.16%
|
| Dry Production | 1.59%
|
-0.16%
|
| Canadian Imports | 2.51%
|
2.61%
|
| West (Net) | 22.91%
|
-12.49%
|
| MidWest (Net) | -13.52%
|
24.74%
|
| Northeast (Net) | 5.92%
|
4.71%
|
| LNG Imports | -61.96%
|
-0.29%
|
| Total Supply | 1.19%
|
0.05%
|
| Source: BENTEK Energy LLC | ||
| U.S. Consumption - Gas Week: (10/3/12 - 10/10/12) | ||
|---|---|---|
Percent change for week compared with: |
||
last year |
last week |
|
| U.S. Consumption | 17.77%
|
5.98%
|
| Power | 13.01%
|
-11.84%
|
| Industrial | 6.13%
|
2.39%
|
| Residential/Commercial | 38.84%
|
44.15%
|
| Total Demand | 18.67%
|
5.95%
|
| Source: BENTEK Energy LLC | ||
| Rigs | |||
|---|---|---|---|
Fri, October 05, 2012 |
Change from |
||
last week |
last year |
||
| Oil Rigs | 1,398 |
-0.85% |
30.65% |
| Natural Gas Rigs | 437 |
0.46% |
-53.26% |
| Miscellaneous | 2 |
-33.33% |
-71.43% |
| Rig Numbers by Type | |||
|---|---|---|---|
Fri, October 05, 2012 |
Change from |
||
last week |
last year |
||
| Vertical | 511 |
-0.58% |
-17.31% |
| Horizontal | 1,132 |
-0.88% |
-1.39% |
| Directional | 194 |
1.04% |
-21.14% |
| Source: Baker Hughes Inc. | |||
| Working Gas in Underground Storage | ||||
|---|---|---|---|---|
Stocks billion cubic feet (bcf) |
||||
| Region | 10/5/12
|
9/28/12
|
change |
|
| East | 2,005 |
1,963 |
42
|
|
| West | 513 |
510 |
3
|
|
| Producing | 1,207 |
1,180 |
27
|
|
| Total | 3,725 |
3,653 |
72
|
|
| Source: U.S. Energy Information Administration | ||||
| Working Gas in Underground Storage | |||||
|---|---|---|---|---|---|
Historical Comparisons |
|||||
Year ago (10/5/11) |
5-year average (2007-2011) |
||||
| Region | Stocks (Bcf) |
% change |
Stocks (Bcf) |
% change |
|
| East | 1,920 |
4.4 |
1,938 |
3.5 |
|
| West | 478 |
7.3 |
471 |
8.9 |
|
| Producing | 1,091 |
10.6 |
1,047 |
15.3 |
|
| Total | 3,489 |
6.8 |
3,456 |
7.8 |
|
| Source: U.S. Energy Information Administration | |||||
| Temperature -- Heating & Cooling Degree Days (week ending Oct 04) | ||||||||
|---|---|---|---|---|---|---|---|---|
HDD deviation from: |
CDD deviation from: |
|||||||
| Region | HDD Current |
normal |
last year |
CDD Current |
normal |
last year |
||
| New England | 51
|
-16
|
22
|
0
|
-1
|
-4
|
||
| Middle Atlantic | 31
|
-24
|
-22
|
4
|
0
|
-2
|
||
| E N Central | 52
|
-6
|
-24
|
0
|
-5
|
0
|
||
| W N Central | 51
|
-5
|
5
|
1
|
-7
|
-4
|
||
| South Atlantic | 12
|
-13
|
-28
|
55
|
13
|
17
|
||
| E S Central | 16
|
-8
|
-28
|
21
|
-6
|
8
|
||
| W S Central | 6
|
0
|
-3
|
45
|
-7
|
-11
|
||
| Mountain | 37
|
-22
|
20
|
35
|
10
|
-5
|
||
| Pacific | 6
|
-13
|
-7
|
52
|
34
|
29
|
||
| United States | 29
|
-12
|
-12
|
27
|
6
|
6
|
||
|
Note: HDD = heating degree-day; CDD = cooling degree-day Source: National Oceanic and Atmospheric Administration | ||||||||
Average temperature (°F)
7-Day Mean ending Oct 04, 2012
Source: NOAA/National Weather Service
Deviation between average and normal (°F)
7-Day Mean ending Oct 04, 2012
Source: NOAA/National Weather Service